(Total Views: 1184)
Posted On: 02/26/2017 4:45:59 PM
Post# of 2561

SPDL Daily Chart ~ Continuing Its Move Higher
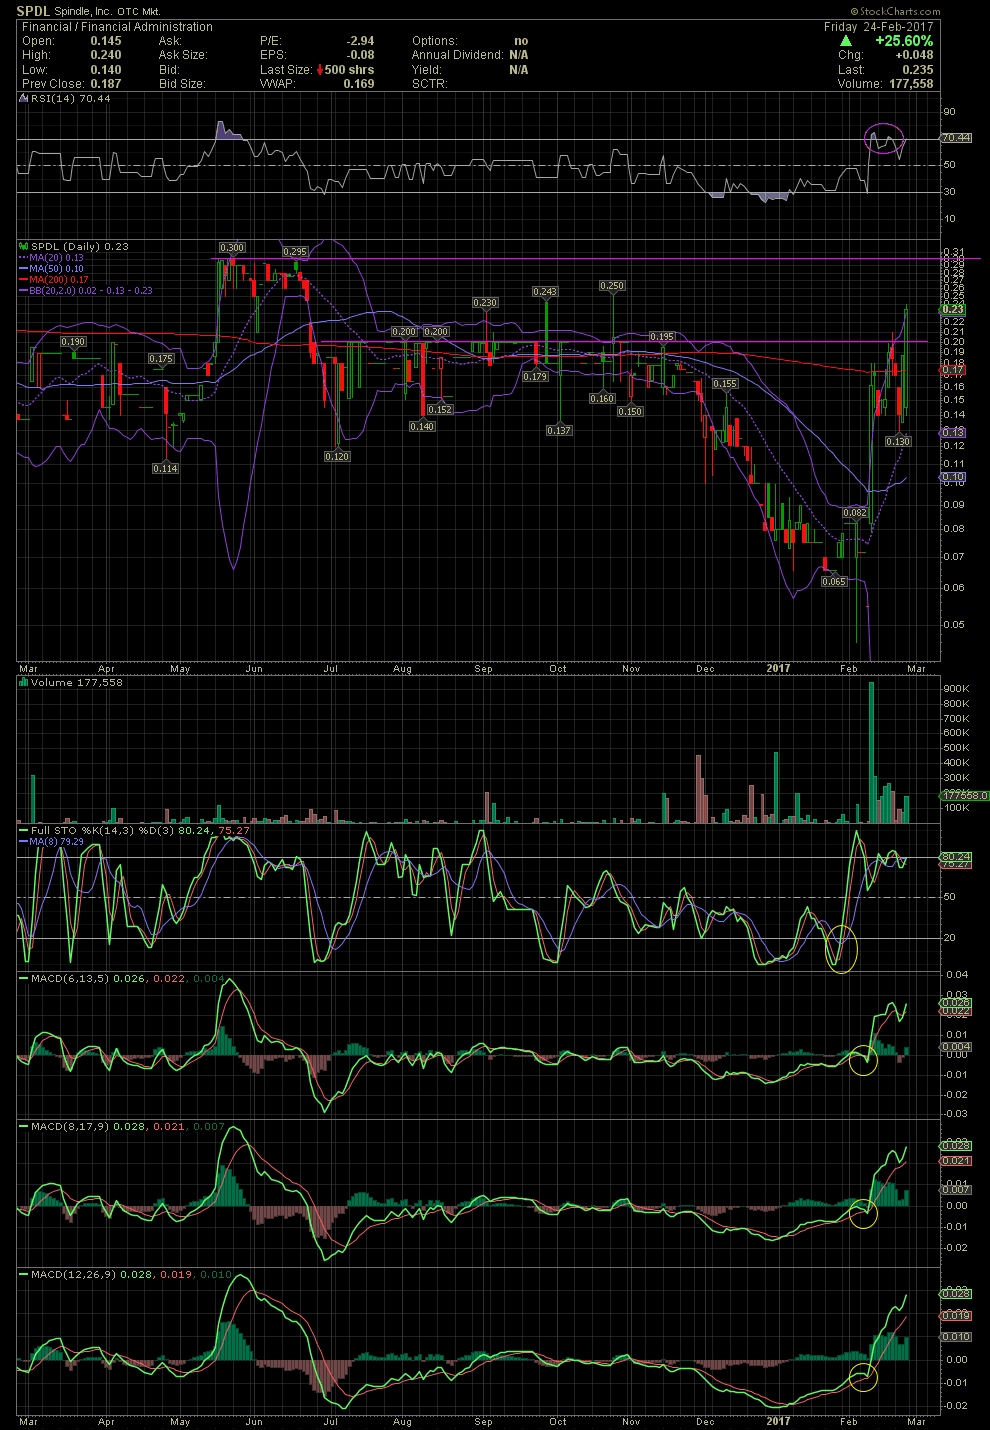
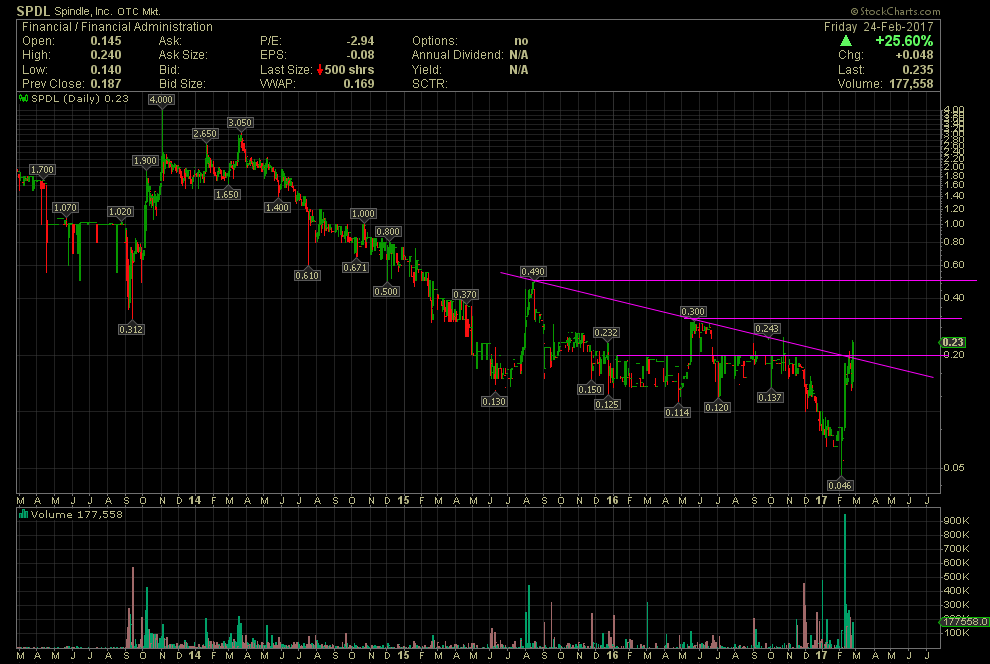
On Feb 9, I shared SPDL. Since then it has appreciated from .079 to Friday's close of .235. Below are two charts. The first is the short term look at the stock's progress. The second chart is a long term view of things with annotated targets of possible horizontal resistance targets.
The .20 resistance line, in place since September, was achieved on Friday. I'm hoping for a day or two over .20, next, to confirm that a longer term upside trend is in effect. The stock is slightly overbought at the moment because of the technical indicators seen on the first chart. Fundamentals will almost always trump technicals, though, so I'm looking for some strong material events to sustain this move higher. On the second chart, one can see the multi-month declining tops line also crossed at approx .20. It also shows the next two horizontal resistance points at .30 and .49. GLTA