Posted On: 02/15/2016 2:46:36 PM
Post# of 2561

IORG Daily Chart ~ Holding Up Extremely Well in a Very Week OTC Market
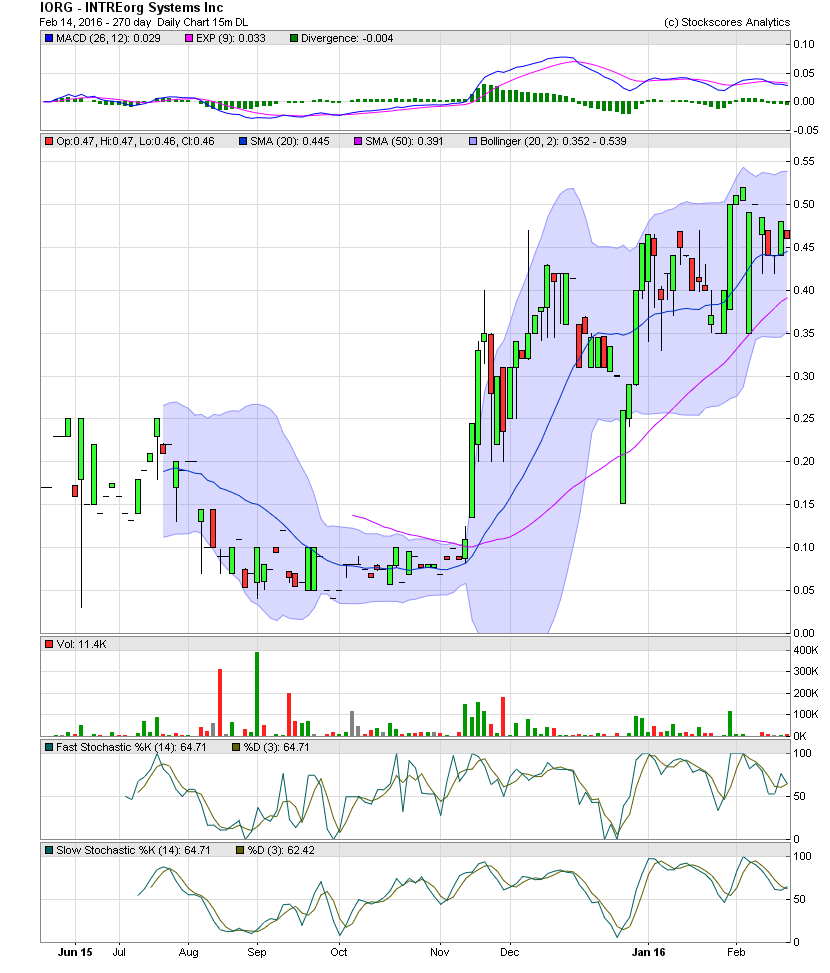
The IORG trading has started to tighten quite a bit as volume has ebbed since the initial move to almost 5 year highs with the closes of .50, .51 and .52 two weeks ago. On the limited technical information this chart shows, the share price is holding just above the MA20 with the occasional bounce off the MA50. The stock is trading well inside the bollie bands during its volatile intraday swings. I'm not sure why this charting service is showing the high of the year at $1.65, but those prices haven't been seen since mid 2011. The highest close since mid 2012 was the previous trading week. I really like the set up on this chart, especially when one considers the horrendous market conditions of the big boards and the OTC. GLTA
The IORG trading has started to tighten quite a bit as volume has ebbed since the initial move to almost 5 year highs with the closes of .50, .51 and .52 two weeks ago. On the limited technical information this chart shows, the share price is holding just above the MA20 with the occasional bounce off the MA50. The stock is trading well inside the bollie bands during its volatile intraday swings. I'm not sure why this charting service is showing the high of the year at $1.65, but those prices haven't been seen since mid 2011. The highest close since mid 2012 was the previous trading week. I really like the set up on this chart, especially when one considers the horrendous market conditions of the big boards and the OTC. GLTA