Posted On: 02/15/2016 2:30:56 PM
Post# of 2561

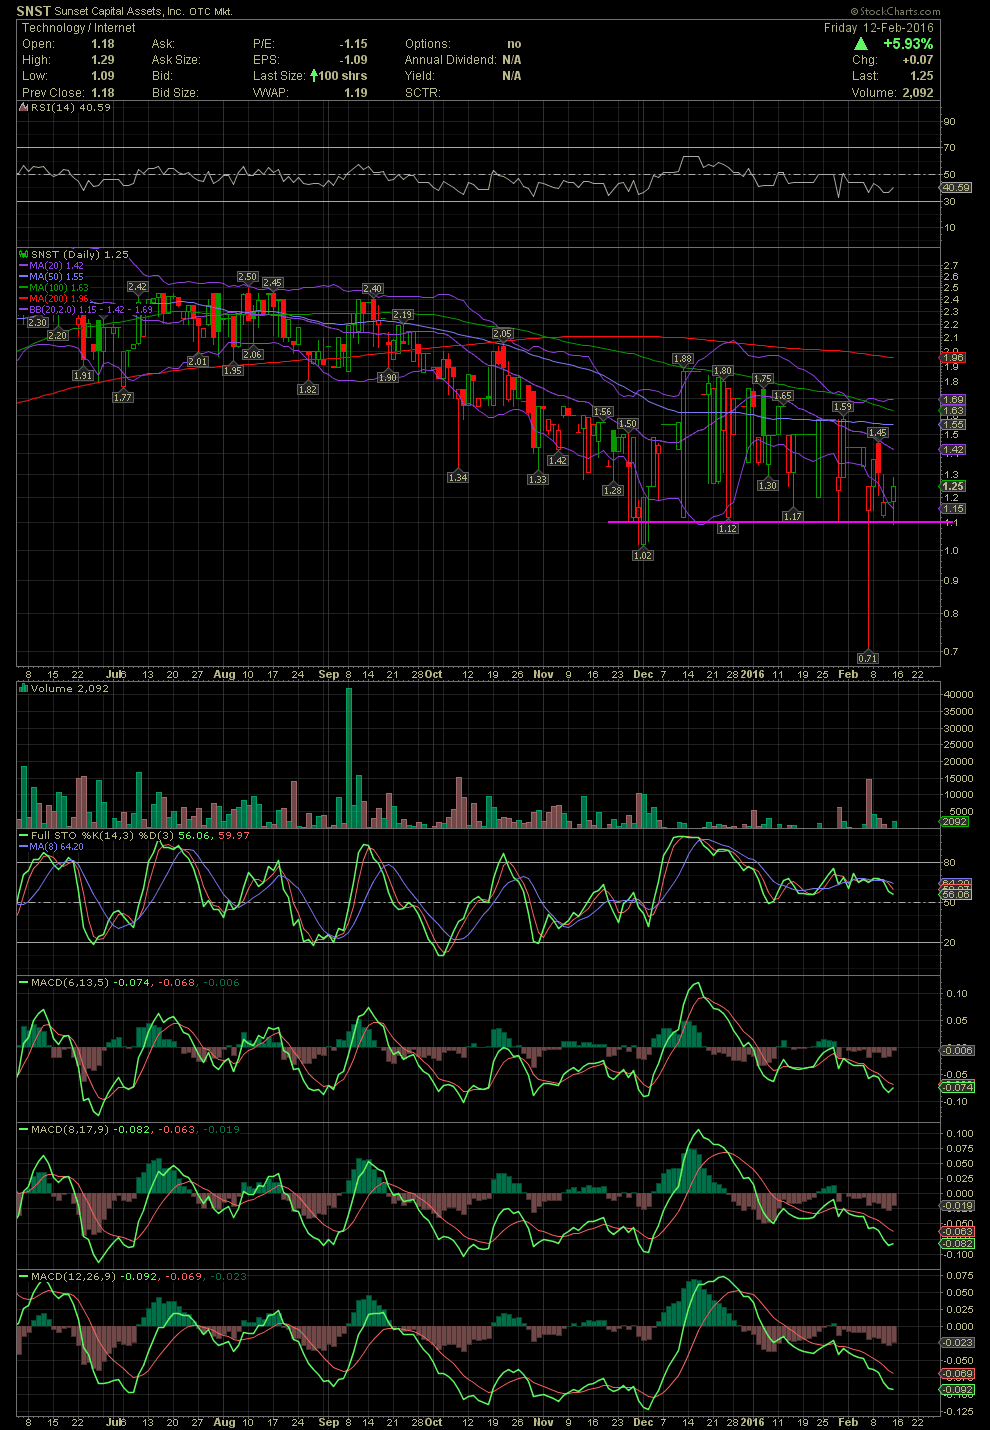
SNST Daily Chart ~ Technicals in Very Oversold Levels
The lack of news/updates from management along with a few impatient investors has led to a gradual decline from the $2.00+ levels to a low of $1.02 in early December, followed by a sharp move to $1.80 before another decline into the low $1.00 area. On the chart, the support area appears to be building at $1.10 with a few intraday moves below. Last week, it looks like a market order took the stock to .71 before snapping back to close at 1.25 and drifting the rest of the week for the same price close. While support can be seen with the line I drew, one can also see the lower highs into this week. The MACDs have declined into very low and oversold areas seen in October into early December. Might the share price finally see a move back up again? Time will tell. A few investors I know, some invested for over two years already from sub .20s to sub .40s, continue to accumulate with the mindset of hopefully seeing the company monetize its assets and begin appreciating towards their stated book value of $40.00+. I'll be following SNST for a long time.
The lack of news/updates from management along with a few impatient investors has led to a gradual decline from the $2.00+ levels to a low of $1.02 in early December, followed by a sharp move to $1.80 before another decline into the low $1.00 area. On the chart, the support area appears to be building at $1.10 with a few intraday moves below. Last week, it looks like a market order took the stock to .71 before snapping back to close at 1.25 and drifting the rest of the week for the same price close. While support can be seen with the line I drew, one can also see the lower highs into this week. The MACDs have declined into very low and oversold areas seen in October into early December. Might the share price finally see a move back up again? Time will tell. A few investors I know, some invested for over two years already from sub .20s to sub .40s, continue to accumulate with the mindset of hopefully seeing the company monetize its assets and begin appreciating towards their stated book value of $40.00+. I'll be following SNST for a long time.