Posted On: 02/15/2016 12:48:29 PM
Post# of 2561

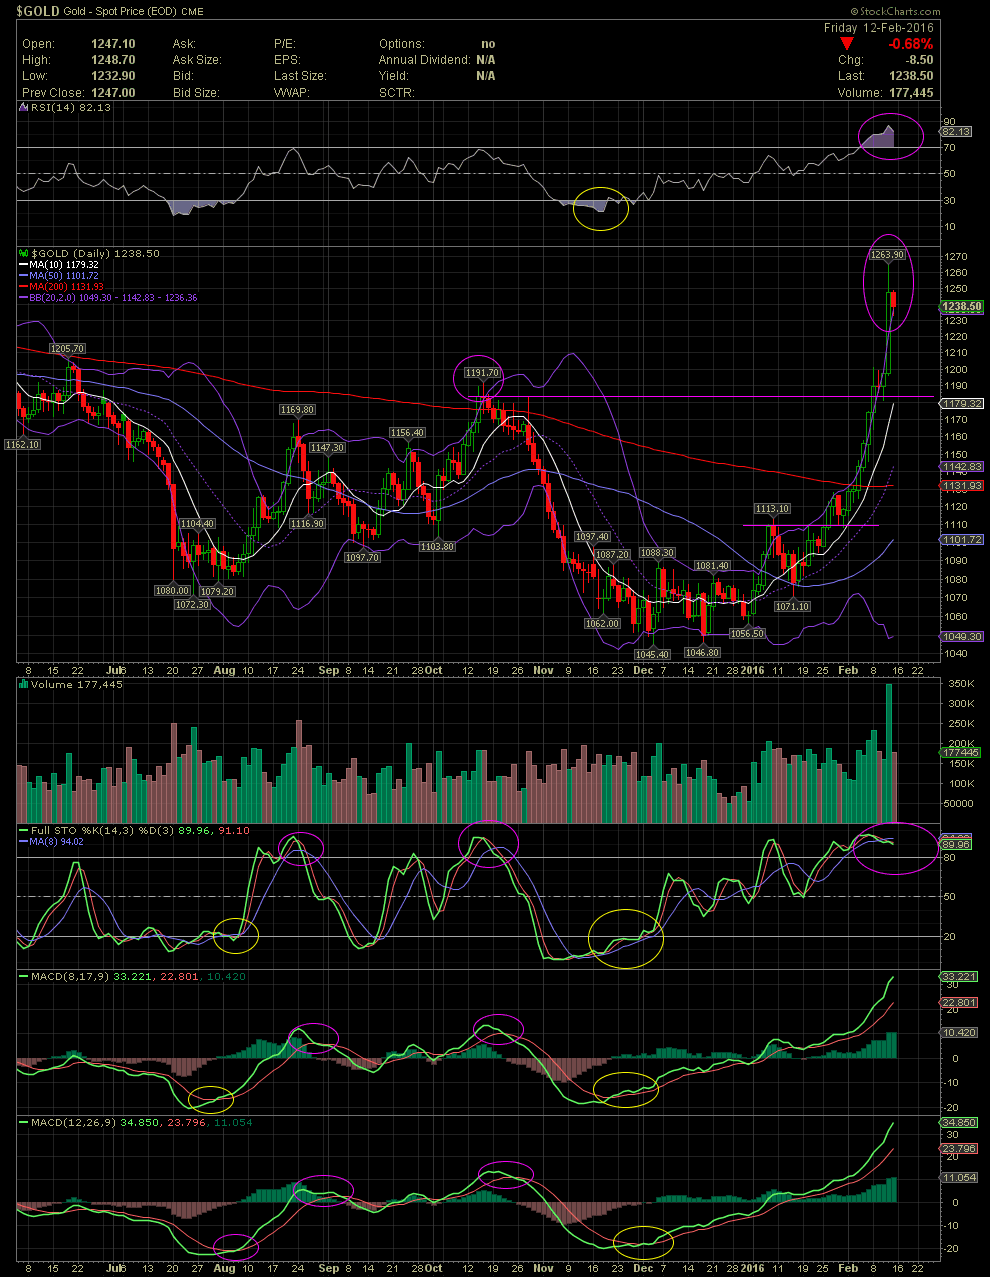
Gold Daily Chart ~ Very Overbought for the Short Term
Link back to previous charts and technicals regarding the bottoming of the Gold chart based on the extremely oversold levels of the FullSto and MACDs. Since the positive crossovers of these indicators in early December, Gold has appreciated by over $200/oz, moving from $1,045 to an intraday high of $1,263.90 on Thursday. Those following along with chart and technicals were able to see the Thursday candle completely outside the upper bollie. Friday saw the beginning of a correction as can be seen with the very overbought levels of the RSI, FullSto and MACDs. How far might Gold now correct? Who knows, but we'll monitor the charts and see where it begins to consolidate and find a new base.
Link back to previous charts and technicals regarding the bottoming of the Gold chart based on the extremely oversold levels of the FullSto and MACDs. Since the positive crossovers of these indicators in early December, Gold has appreciated by over $200/oz, moving from $1,045 to an intraday high of $1,263.90 on Thursday. Those following along with chart and technicals were able to see the Thursday candle completely outside the upper bollie. Friday saw the beginning of a correction as can be seen with the very overbought levels of the RSI, FullSto and MACDs. How far might Gold now correct? Who knows, but we'll monitor the charts and see where it begins to consolidate and find a new base.