Posted On: 02/15/2016 12:43:26 PM
Post# of 2561

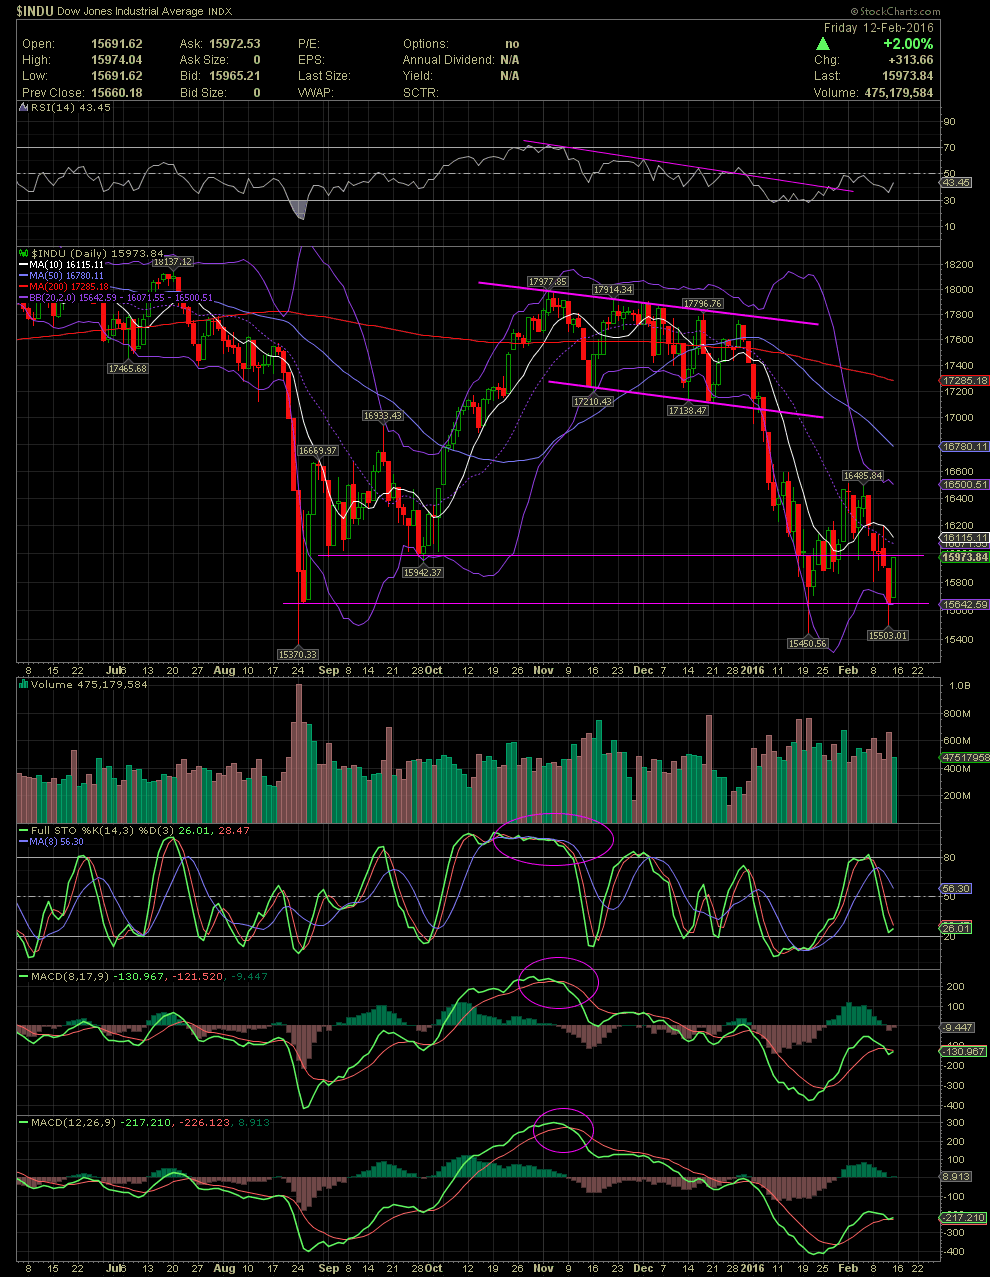
INDU Daily Chart ~ Churning at Short Term Support
Following the big boards and big board stocks becomes a lot easier when one is able to use charts and technicals to better calculate one's entries and exits. It also work for OTC stocks, but due to the extreme amount of manipulations from numerous factions, it's quite a bit more difficult.
The major correction in the INDU actually began in November when the FullSto and MACDs began their red crossovers and negative divergence. Since the decline gained momentum in early 2016, the talking heads began to seek explanations for the drop, which included China, oil price declines and a lot of other post decline gibberish. The fact of the matter is, if one paid attention to the technicals within the charts, they would have moved some funds to the sidelines as weakness began to develop. The support lines on the chart have been there for months. The first failed while the second has held for 3 weeks now. How far a correction will run is anyone's guess. One should now be waiting for a clear indicator of when the technicals have reset and are projecting a better entry than attempting to catch a falling knife.