Posted On: 12/22/2015 5:04:28 PM
Post# of 4425

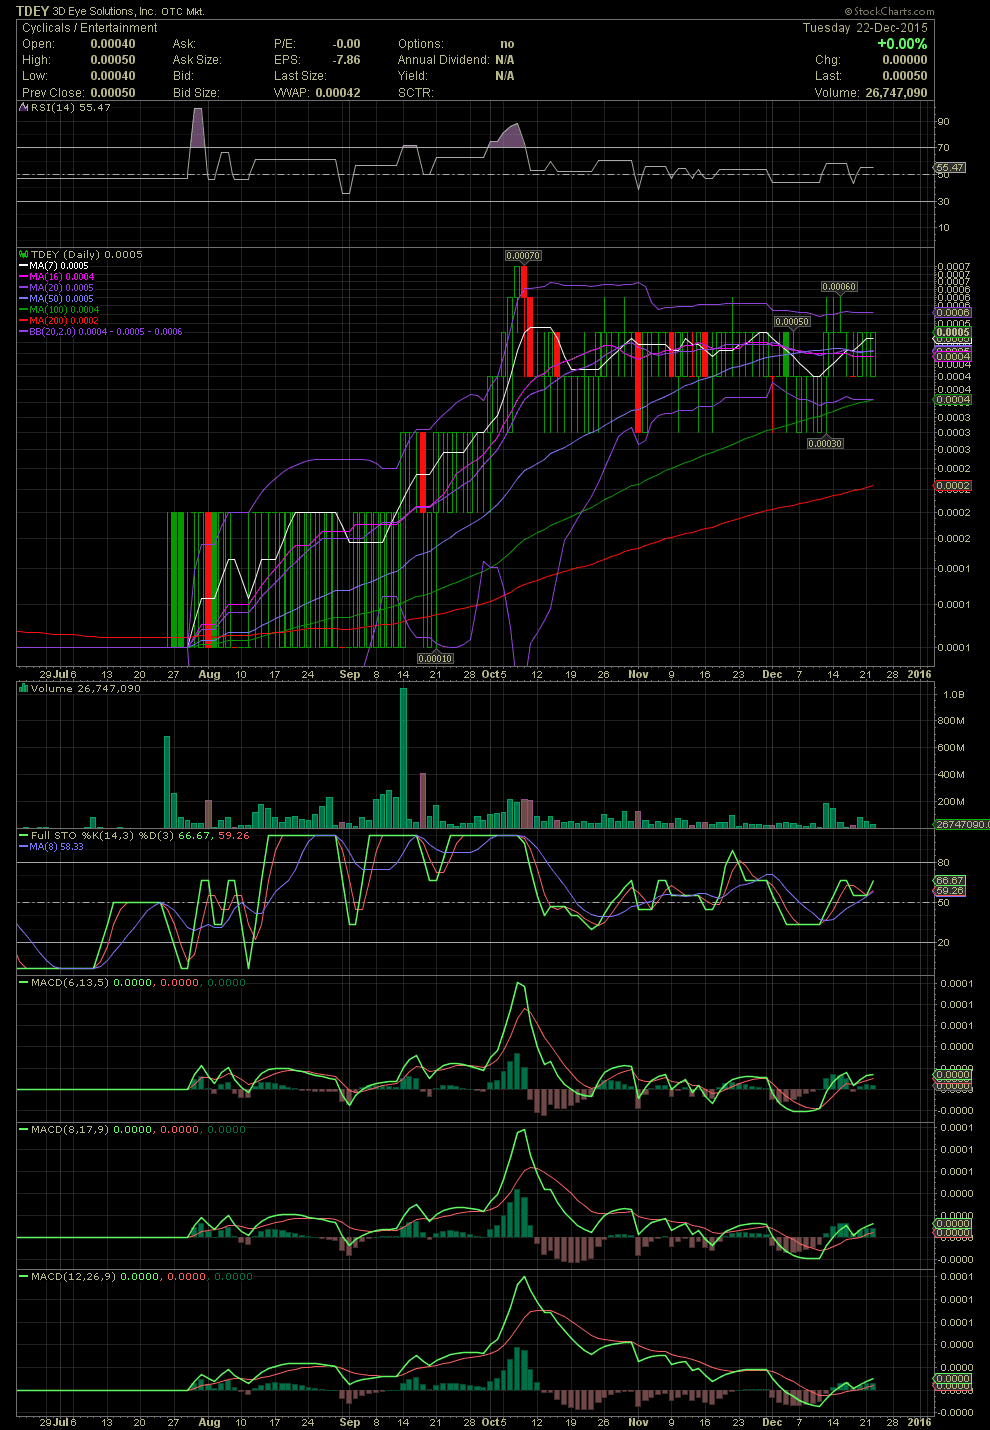
TDEY Daily Chart ~ Setting Up Nicely
If you are following the charts and technicals at all, you have probably already noticed that the FullSTo and MACDs have been resetting after being in the nose bleed sections from mid October. While many scream about the bullshit of "Power Zone" with the RSI way over 70, it's actually a sell signal virtually every time. That, coinciding with the Full and Ms being way overbought also, the stock was a short term sell if one were flipping.
The opposite positioning of the technicals are now in play. The RSI is near its 50 line. The FullSto held over its 50 line and beginning to rise again. The MACDs, two of which I tweaked for my use, have all crossed into a positive position and are beginning to diverge as they have moved above their zero points on the histograms.
Just about go time after almost 3 months on consolidation imo.