Posted On: 03/30/2014 7:48:09 PM
Post# of 2561

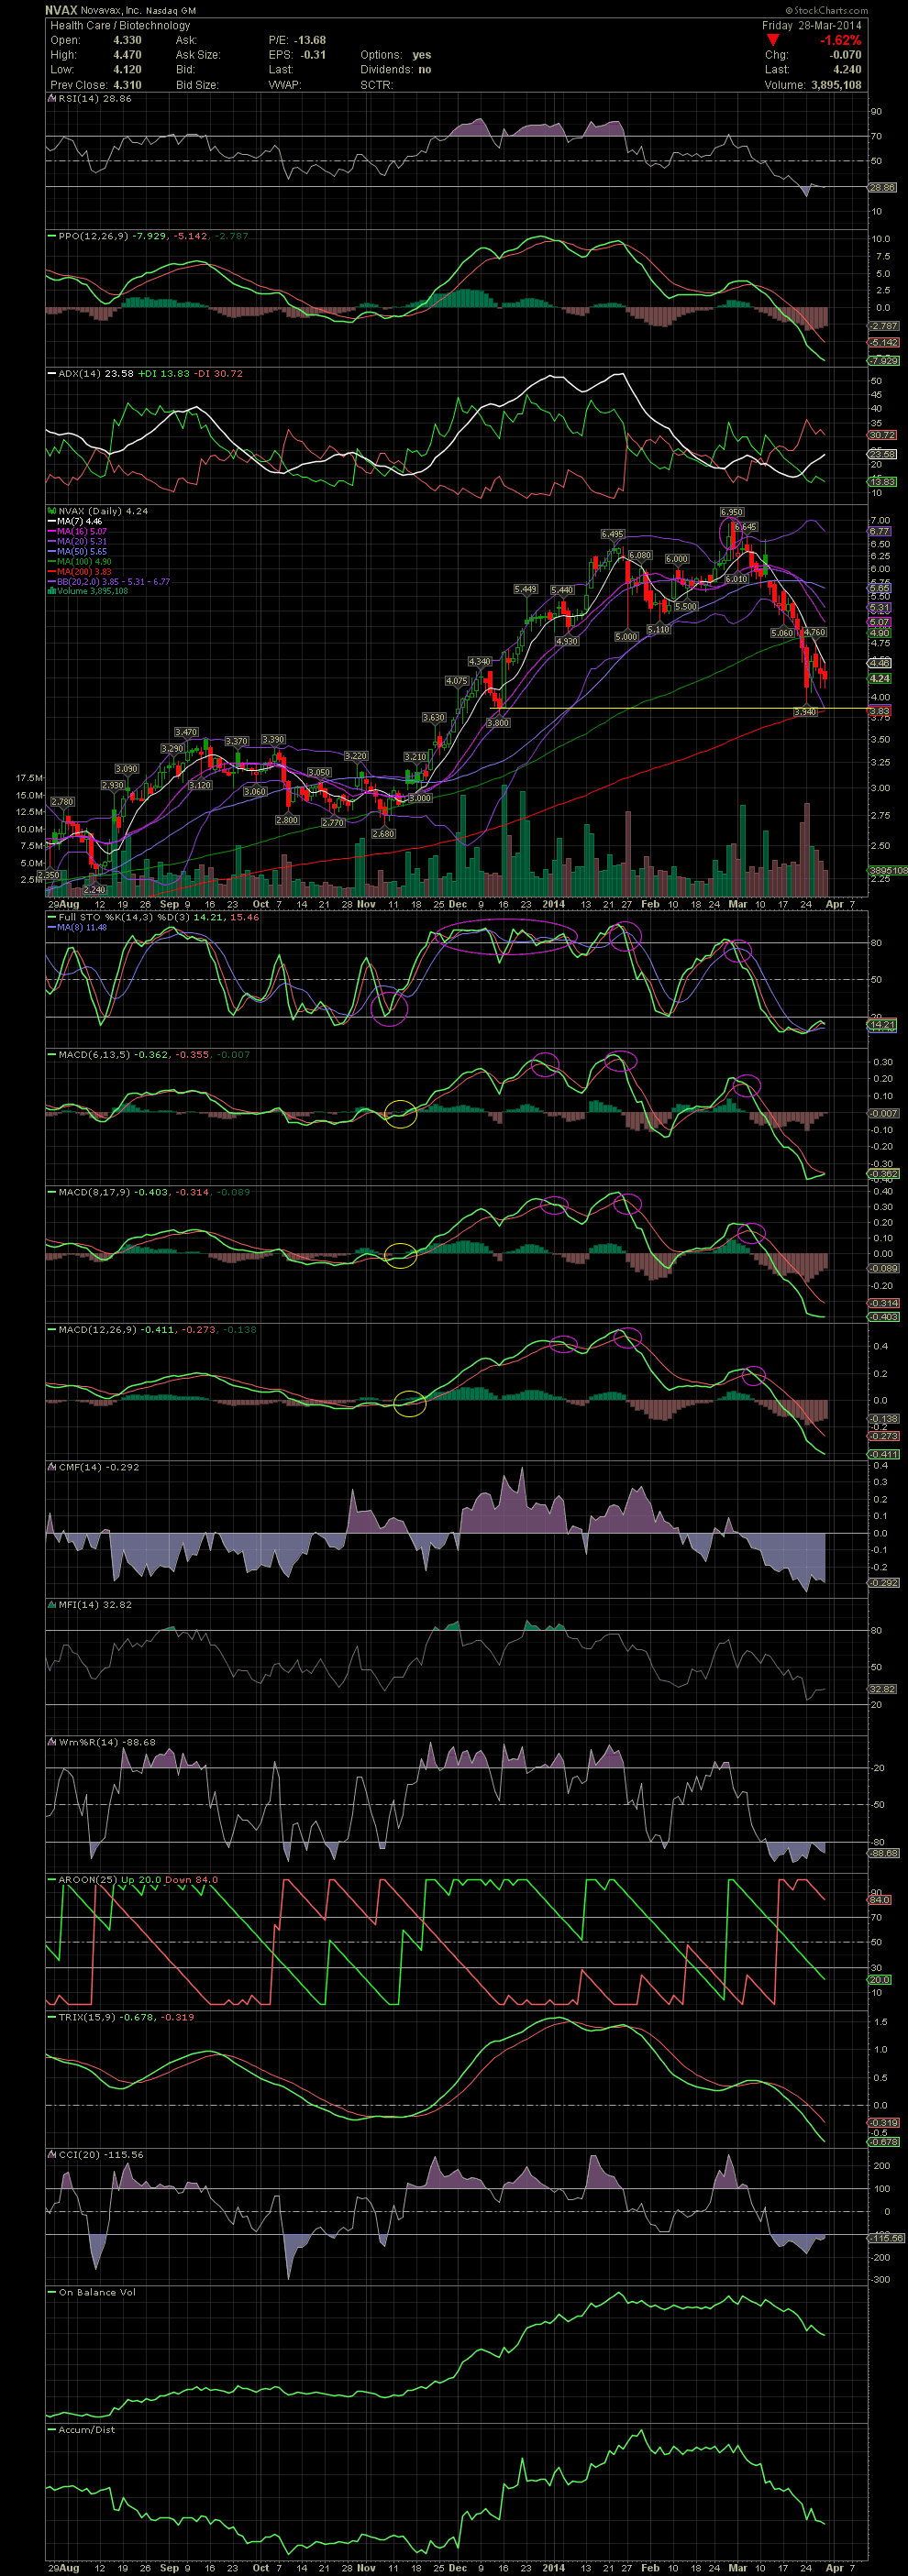
$NVAX Daily Chart ~ Plenty of Red
The move from 3.80 to 6.95 took almost three months while the drop from 6.95 to 3.94 took just 3 weeks. Since my last chart on NVAX, the stock has lost as much as another .70. Our exits in the high 6.00s are looking really good now. OUCH! for those that don't listen to the chart. GREAT! for those swing trading and listening to the charts. Looking at the charts, it's almost time to begin taking a position in NVAX. Note the positioning of the FullSto and MACDs. They are extremely oversold, leveling out, and getting ready for crossovers. Could the previous low and support line (yellow) be seen yet, or is the 4.00/4.10 area going to prove to be the bottom. I don't know, but I may begin taking a small position this week. Eventually, the biotech/pharma sectors will stop bleeding, and there will be plenty of cheaps to be had. GLTA
The move from 3.80 to 6.95 took almost three months while the drop from 6.95 to 3.94 took just 3 weeks. Since my last chart on NVAX, the stock has lost as much as another .70. Our exits in the high 6.00s are looking really good now. OUCH! for those that don't listen to the chart. GREAT! for those swing trading and listening to the charts. Looking at the charts, it's almost time to begin taking a position in NVAX. Note the positioning of the FullSto and MACDs. They are extremely oversold, leveling out, and getting ready for crossovers. Could the previous low and support line (yellow) be seen yet, or is the 4.00/4.10 area going to prove to be the bottom. I don't know, but I may begin taking a small position this week. Eventually, the biotech/pharma sectors will stop bleeding, and there will be plenty of cheaps to be had. GLTA