Posted On: 03/23/2014 3:44:34 PM
Post# of 2561

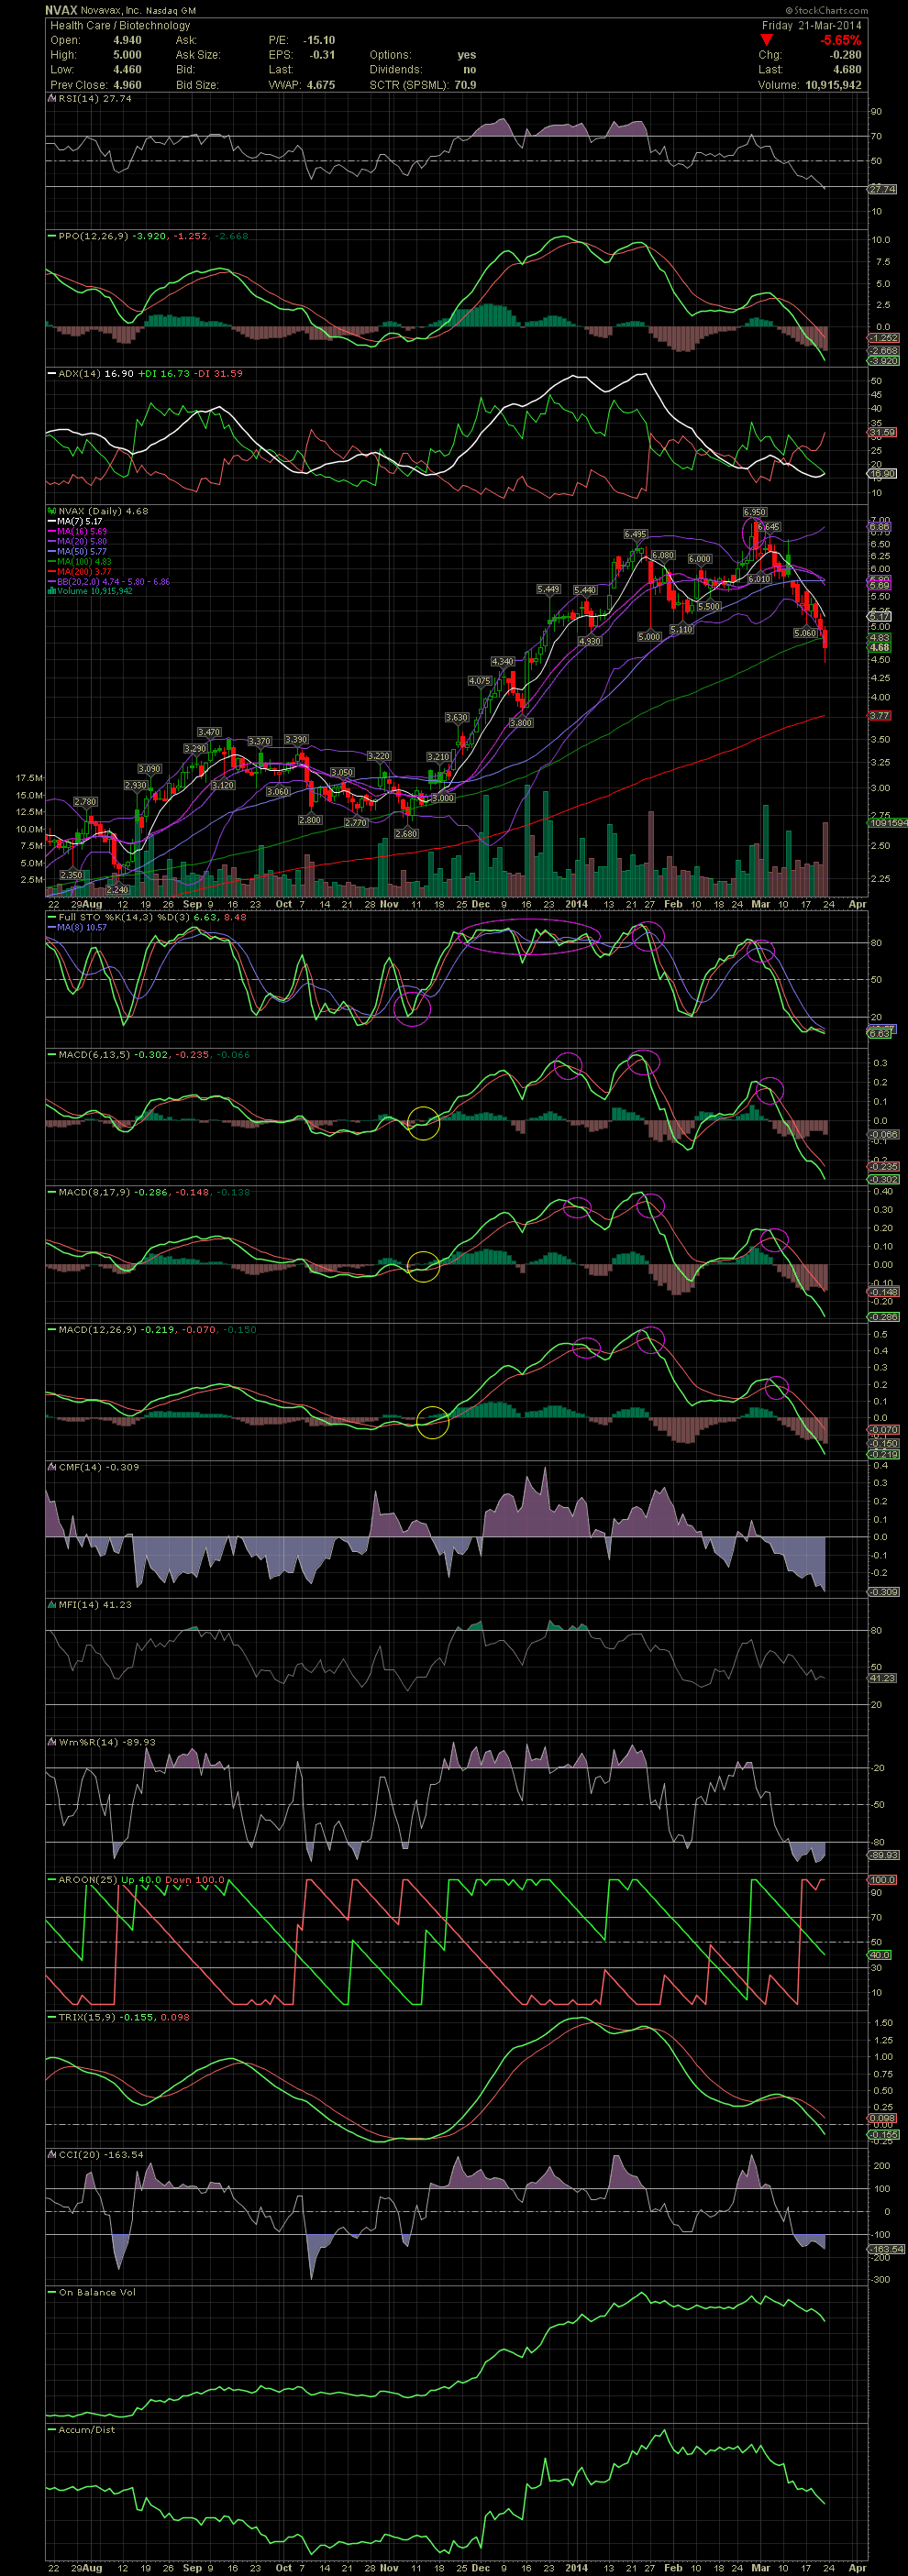
NVAX Daily Chart ~ Continued Selloff Since Our Exits
The indicators for NVAX continue very negative although now deeply into oversold levels. I was asked for a chart and my thoughts on NVAX and if I'm considering a re-entry yet. My answer to him was not yet but I do have the stock on my watchlist. The obvious sell on the last swing trade for a few friends, was when the stock ran outside the upper bollie and especially on the gap opening to 6.95 three weeks ago. The sell signal was confirmed a few days later when the FullSto and all three MACDs crossed over to the negative. For those that got out when they were supposed to, NVAX has been a great stock with yet another successful swing. For those that are holding, it's another week of the short term saga, 'Barf-O-Rama' with a decline of over 35% from top to low so far. Use your charts and indicators people. They really do work. GLTA
The indicators for NVAX continue very negative although now deeply into oversold levels. I was asked for a chart and my thoughts on NVAX and if I'm considering a re-entry yet. My answer to him was not yet but I do have the stock on my watchlist. The obvious sell on the last swing trade for a few friends, was when the stock ran outside the upper bollie and especially on the gap opening to 6.95 three weeks ago. The sell signal was confirmed a few days later when the FullSto and all three MACDs crossed over to the negative. For those that got out when they were supposed to, NVAX has been a great stock with yet another successful swing. For those that are holding, it's another week of the short term saga, 'Barf-O-Rama' with a decline of over 35% from top to low so far. Use your charts and indicators people. They really do work. GLTA