Posted On: 03/16/2014 9:19:04 PM
Post# of 2561
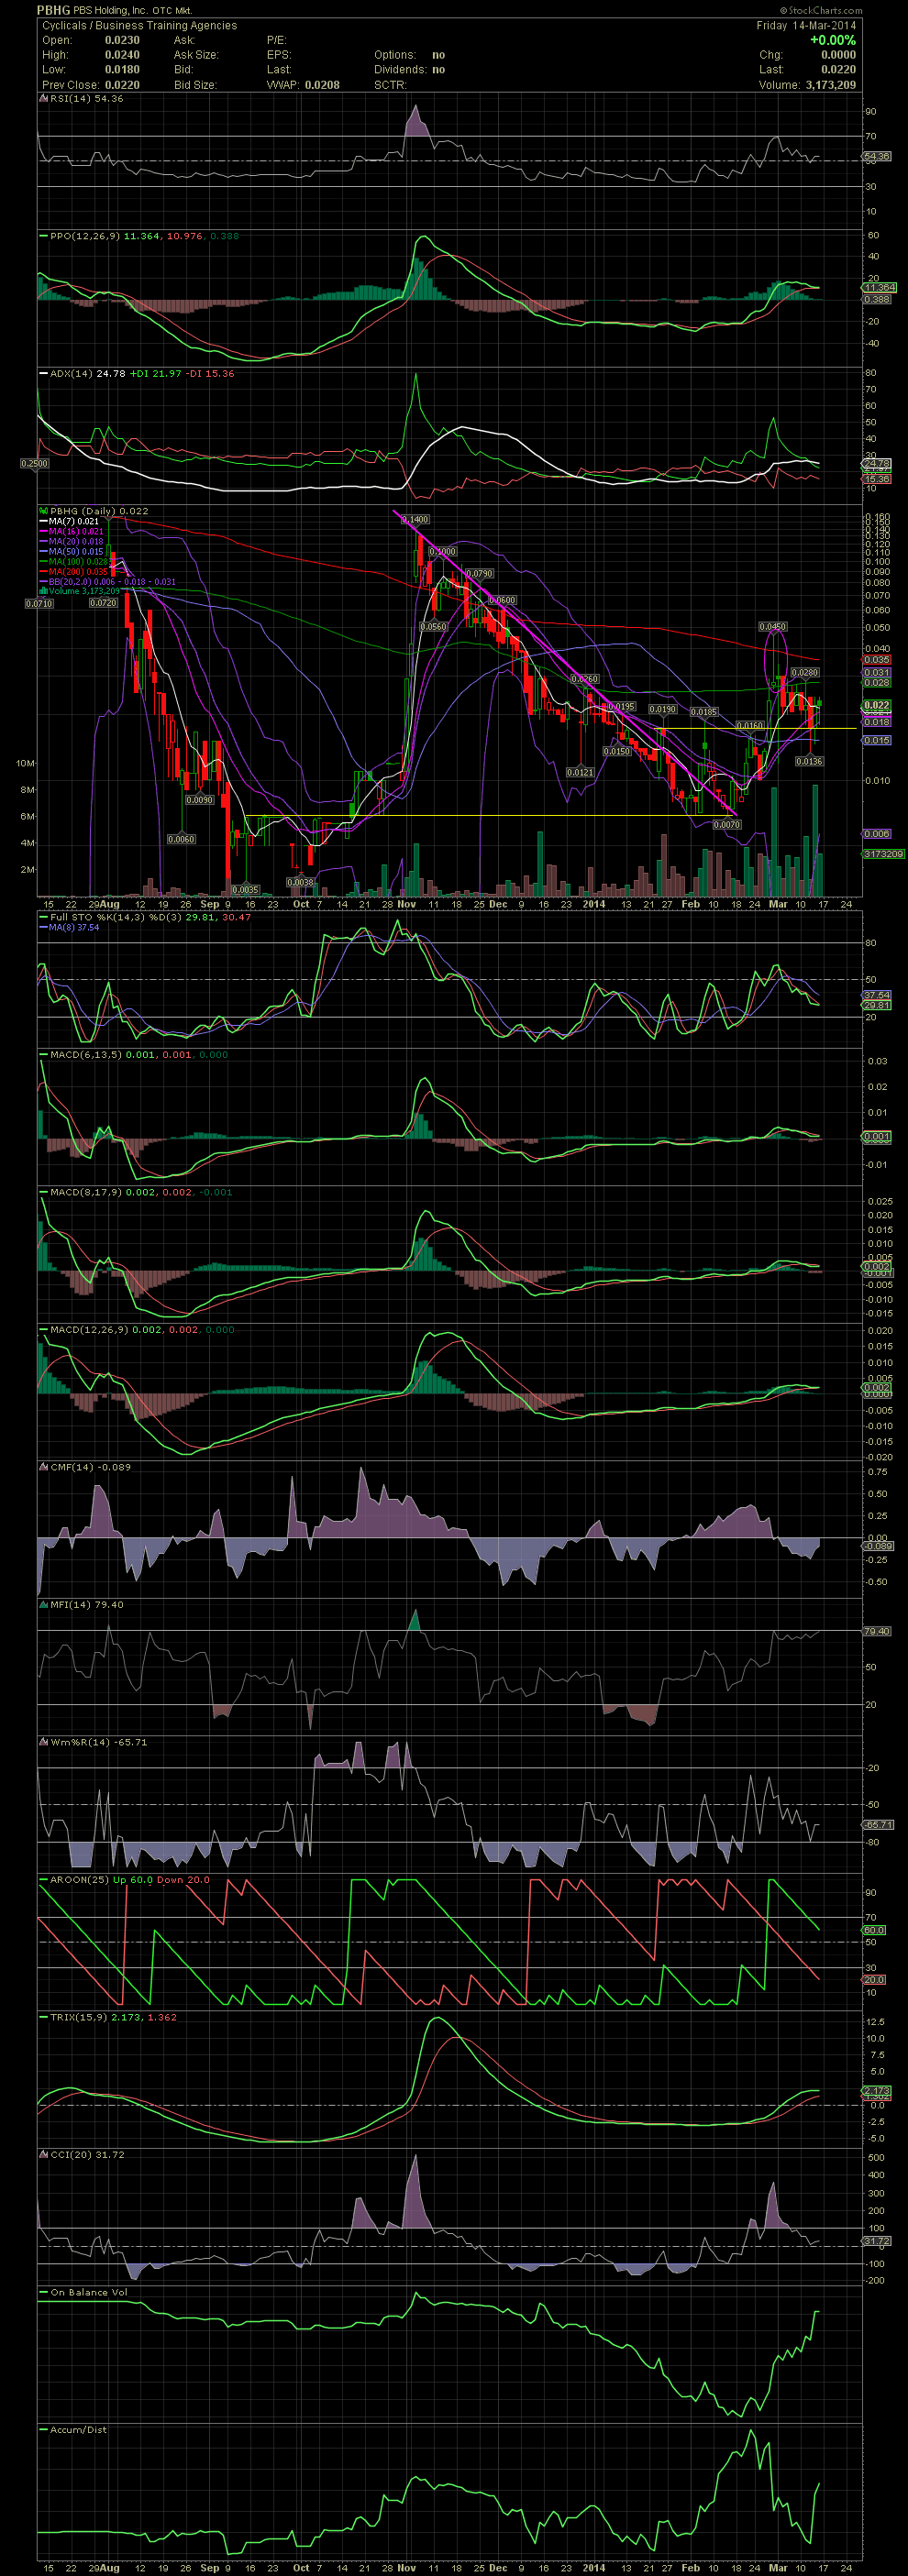
PBHG Daily Chart ~ Finding Support in the .0017/.0018s
Anyone involved with PBHG is probably also aware of TDEY. The chart formations are very similar. So one could transpose the comments of TDEY and apply them to the chart of PBHG other than the prices. The positioning of the MACDs would suggest to me that a nice move up could occur with any solid, material news. A close above .028 and capturing the MA200 at .035 would be very significant on a technical basis. Keep an eye on the upper bollie should the stock spike up during a one day event as was seen with the move to .045 two weeks ago. Outside the upper bollie usually means just one thing. If you don't know that by now, then you just began following me here with this post being your first you've read. GLTA

Anyone involved with PBHG is probably also aware of TDEY. The chart formations are very similar. So one could transpose the comments of TDEY and apply them to the chart of PBHG other than the prices. The positioning of the MACDs would suggest to me that a nice move up could occur with any solid, material news. A close above .028 and capturing the MA200 at .035 would be very significant on a technical basis. Keep an eye on the upper bollie should the stock spike up during a one day event as was seen with the move to .045 two weeks ago. Outside the upper bollie usually means just one thing. If you don't know that by now, then you just began following me here with this post being your first you've read. GLTA


