Posted On: 03/16/2014 8:54:33 PM
Post# of 2561

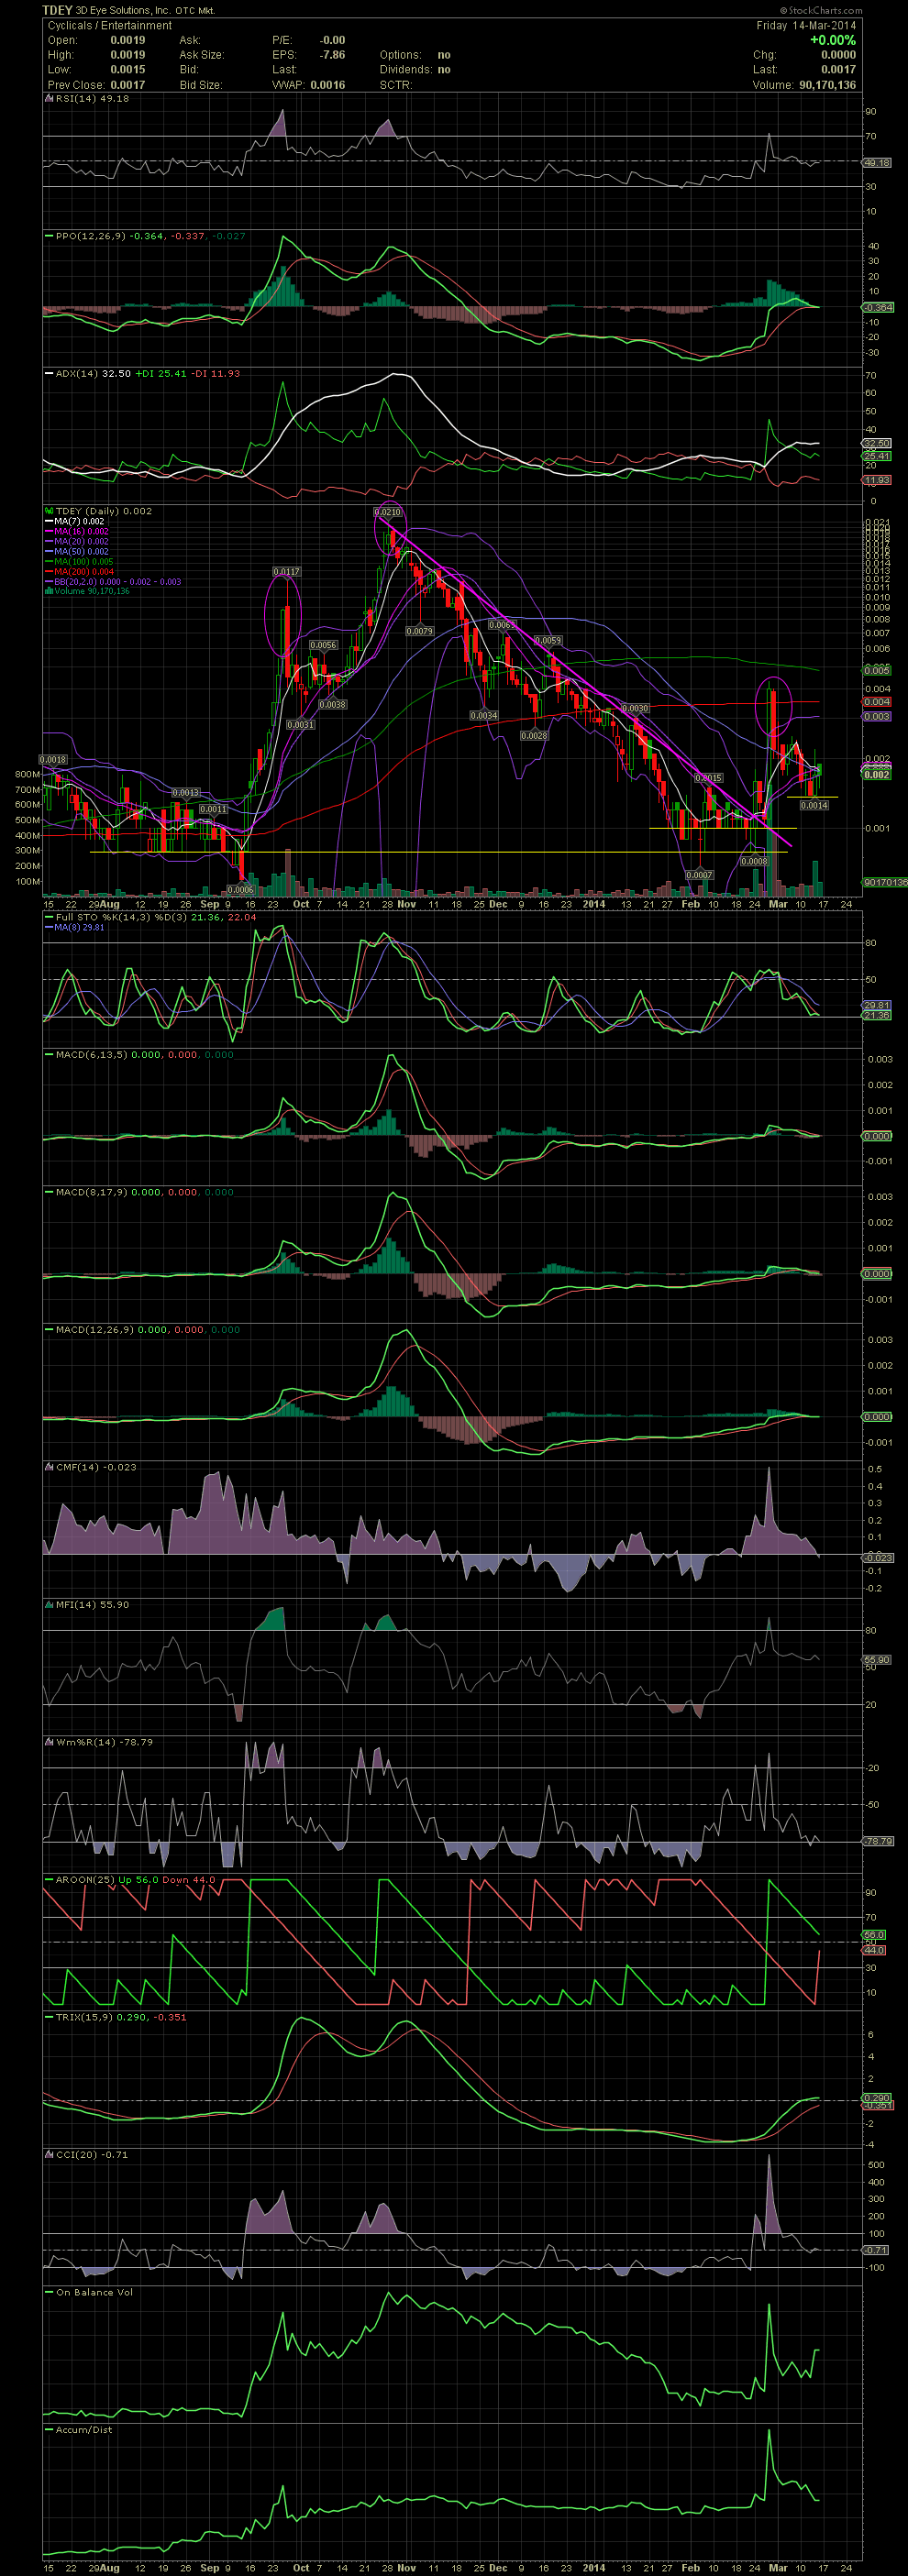
TDEY Daily Chart ~ Attempting to Establish a Bottom at .0014
As I mentioned on March 10, TDEY needs to get over the .0025 level in order to confirm a technical breakout to the upside. So far that hasn't occurred but a possible bottom at .0014 just might have been put it after one week of holding that level. As with most of the bloated OS/floats in stock with 1 billion plus counts, you'll continue to see massive amounts of flipping from those that are happy with 10-30% moves. As long as the stock trends from .0014 to the low .002s, that flipping will continue. TDEY could just as easily continue to trending at these levels aw well as beginning a new leg up. No way of predicting that. But it appears that shares purchased in the .0014/.0015 area might be the bottom. GLTA
As I mentioned on March 10, TDEY needs to get over the .0025 level in order to confirm a technical breakout to the upside. So far that hasn't occurred but a possible bottom at .0014 just might have been put it after one week of holding that level. As with most of the bloated OS/floats in stock with 1 billion plus counts, you'll continue to see massive amounts of flipping from those that are happy with 10-30% moves. As long as the stock trends from .0014 to the low .002s, that flipping will continue. TDEY could just as easily continue to trending at these levels aw well as beginning a new leg up. No way of predicting that. But it appears that shares purchased in the .0014/.0015 area might be the bottom. GLTA