Posted On: 03/16/2014 6:14:32 PM
Post# of 2561
AGDY Weekly Chart ~ Consolidation with Higher Lows Since the Pullback
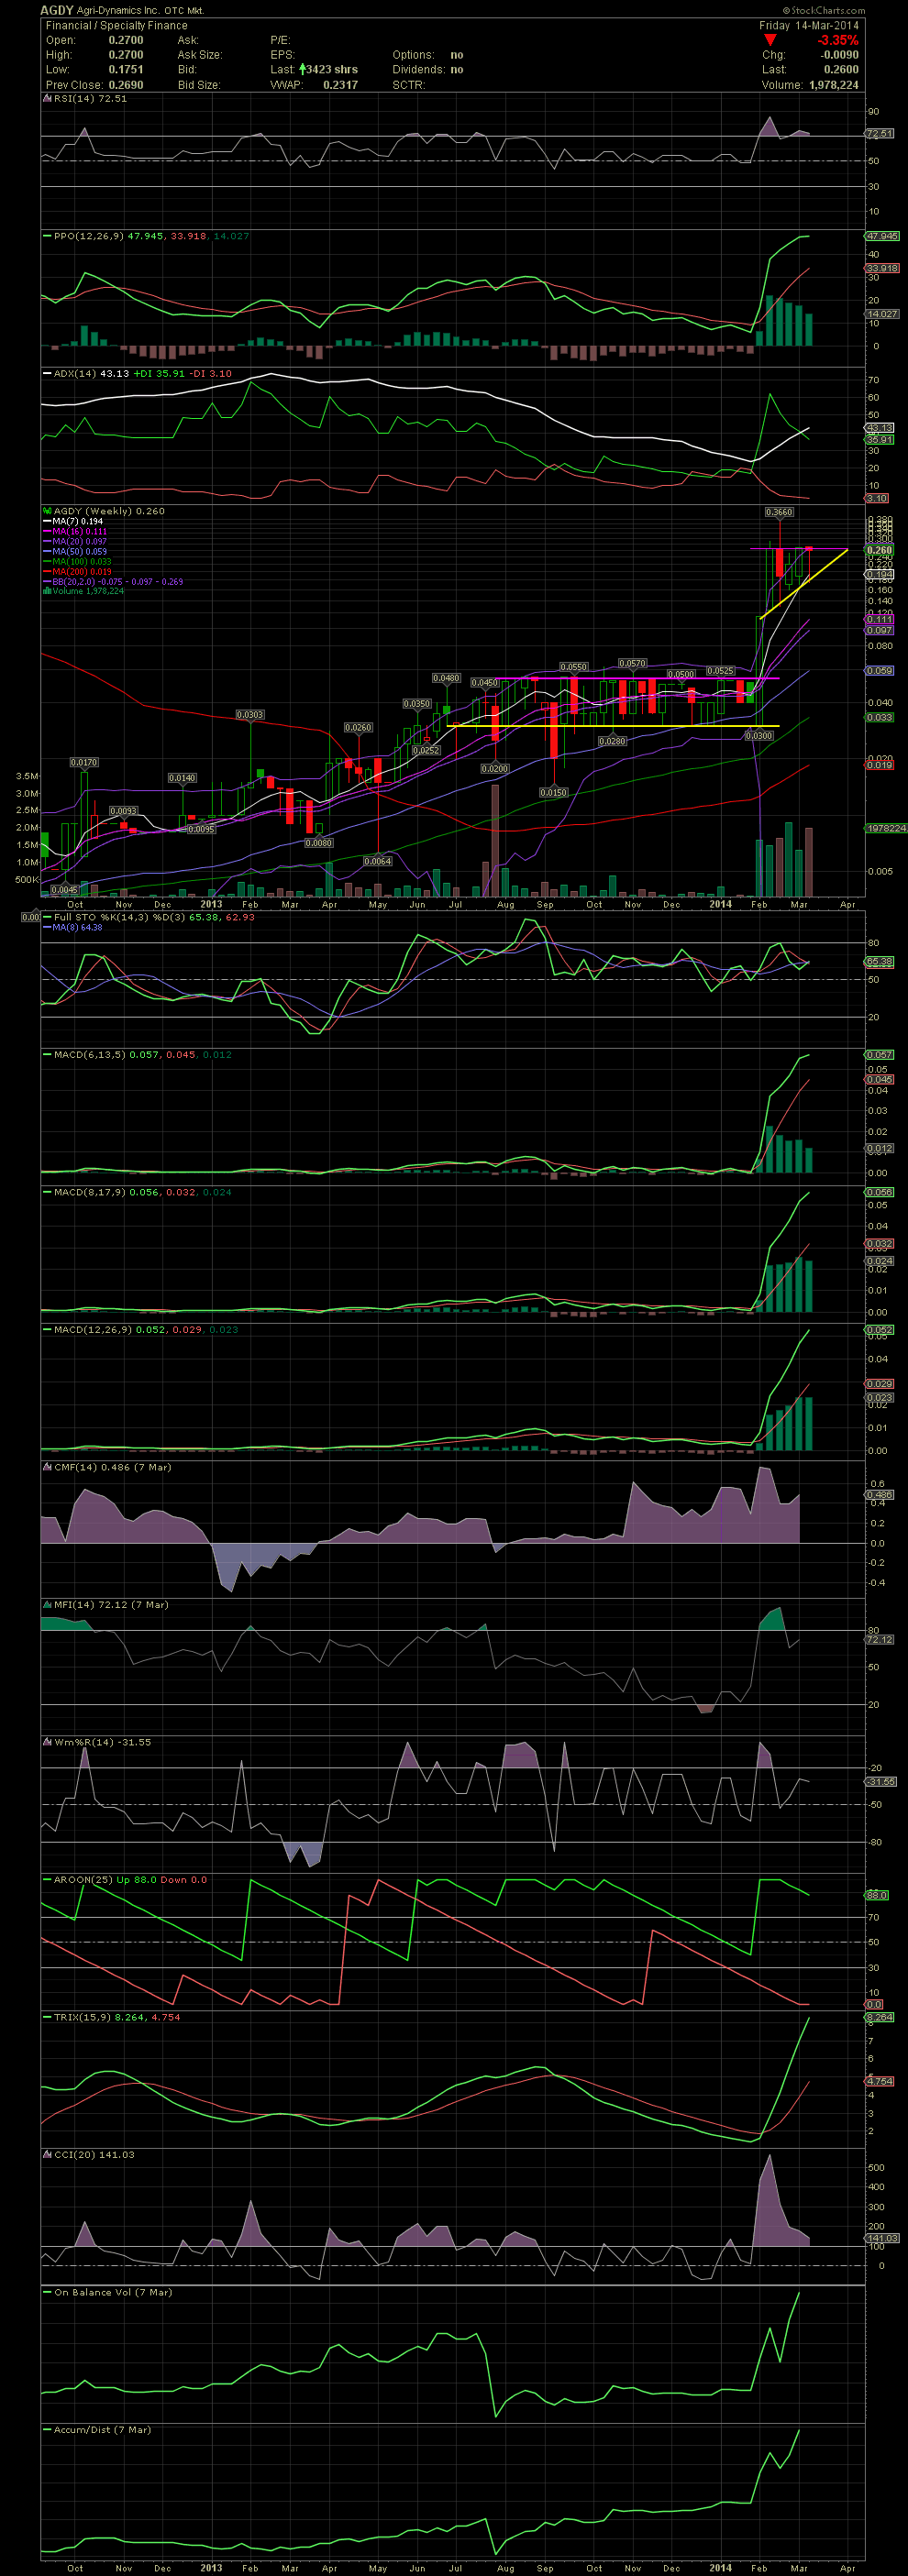
As I mentioned with on the Daily Chart, AGDY is showing higher lows since the correction to .366 and drop to .13. A strong formation which bodes well for an imminent move to higher levels after four weeks of consolidation withe the short term, profit takers move on and their shares have been absorbed by investors looking for higher prices over the longer hold. I'm thinking this week the .20s/30s will be behind us with the .40s/.50s seen. GLTA

As I mentioned with on the Daily Chart, AGDY is showing higher lows since the correction to .366 and drop to .13. A strong formation which bodes well for an imminent move to higher levels after four weeks of consolidation withe the short term, profit takers move on and their shares have been absorbed by investors looking for higher prices over the longer hold. I'm thinking this week the .20s/30s will be behind us with the .40s/.50s seen. GLTA


