Posted On: 03/16/2014 6:01:14 PM
Post# of 2561
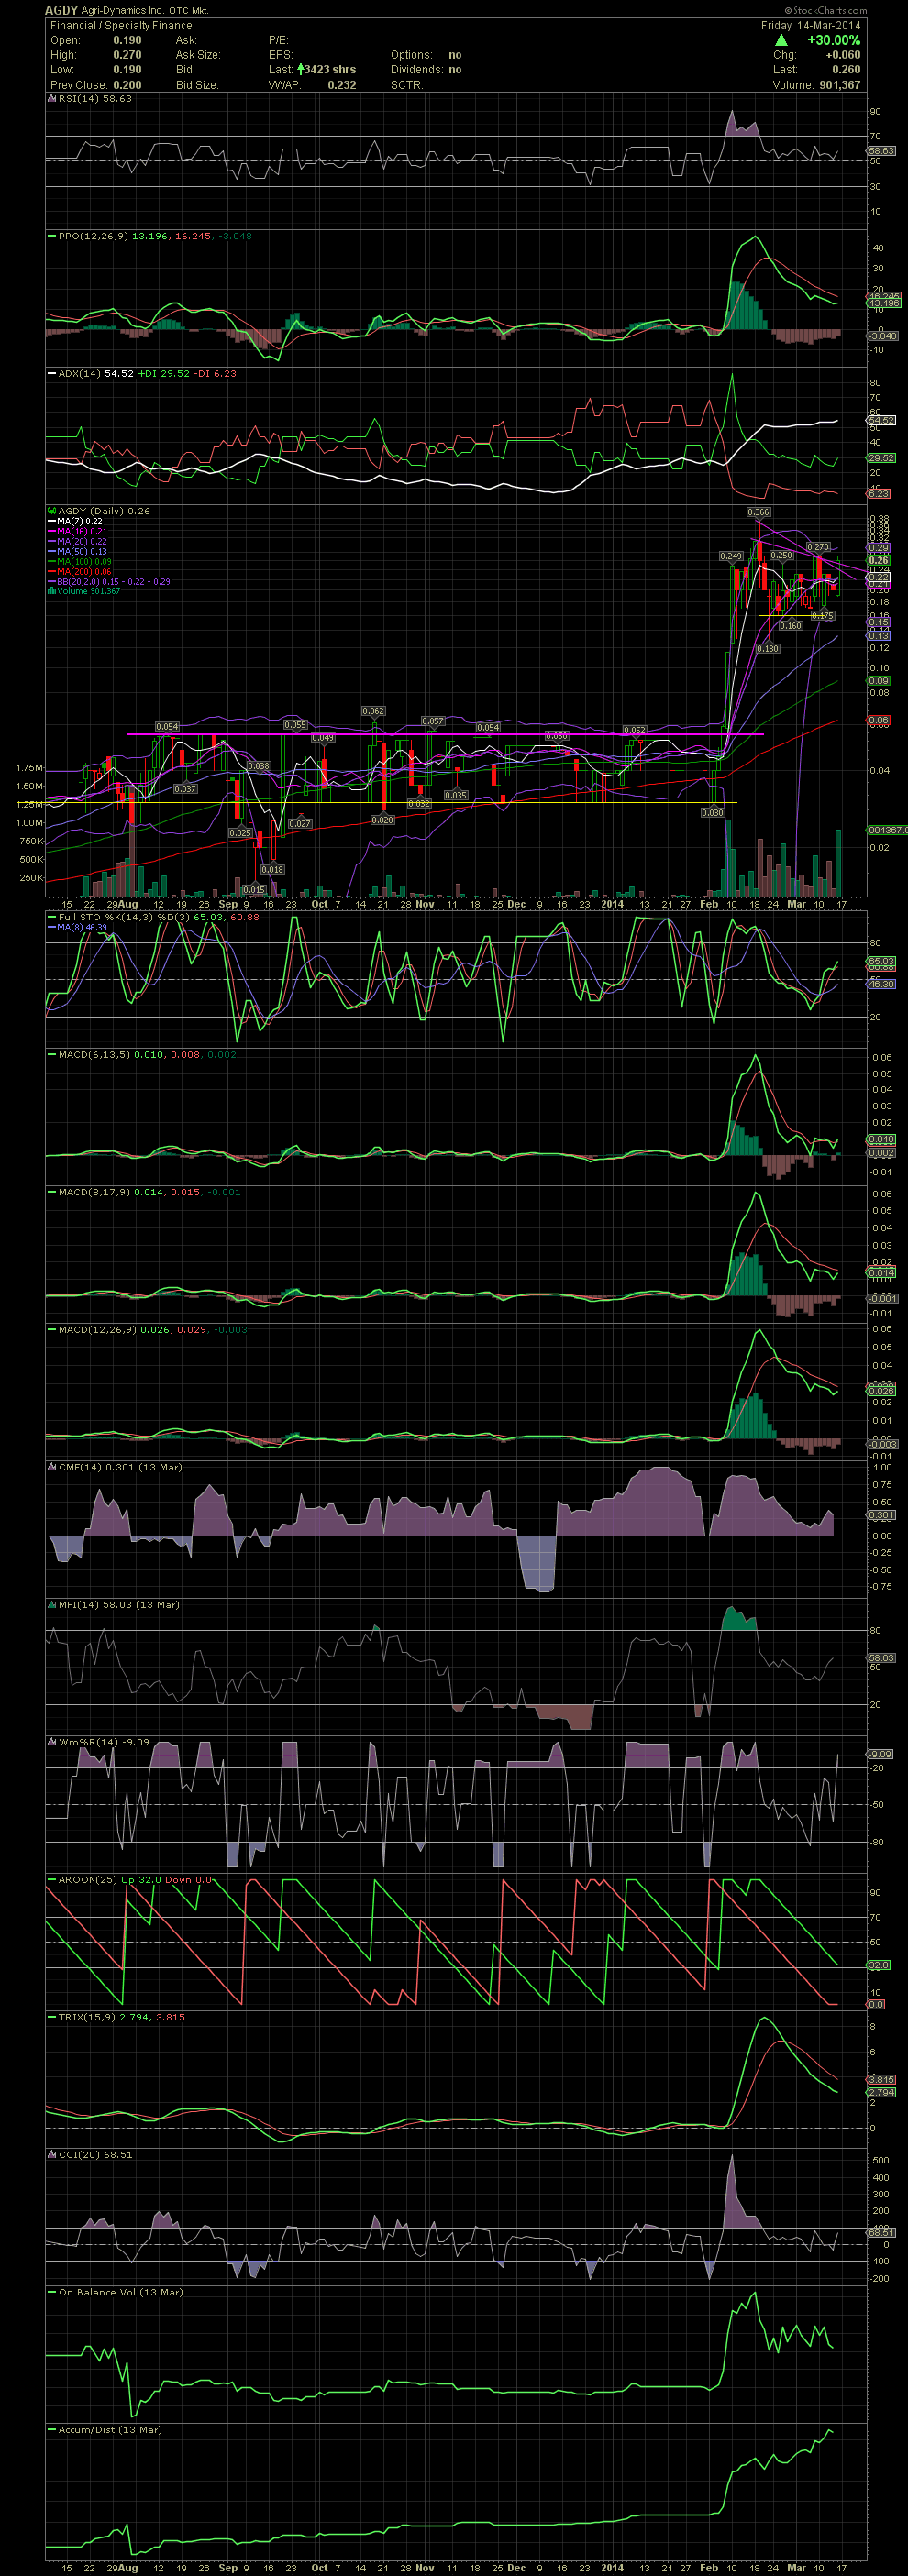
AGDY Daily Chart ~ Looking Like an Imminent Break to the Upside
I added more AGDY this week, along with a few friends, from the .17s to as high as .26. The RSI has bounced off the 50 line three times since the one week run from .03 to .366. The FullSto and fast MACD have reset from very overbought levels and have actually gone to positive crossovers. The 8d and 12d MACDs have also leveled out over the last week and are positioned for their crossovers to the buy side. If one looks closely, you can see that the short term declining tops line are being surpassed. Rumors have it off majors news items coming soon, and that's probably why the stock has well over the last three weeks, and the lows are gradually moving higher since the .13 low after the correction. My guess is .50-.75 over the next couple of weeks. Those of you who accumulated the .00s to .05s over the last year should be smiling now. But the real move is yet to come. GLTA

I added more AGDY this week, along with a few friends, from the .17s to as high as .26. The RSI has bounced off the 50 line three times since the one week run from .03 to .366. The FullSto and fast MACD have reset from very overbought levels and have actually gone to positive crossovers. The 8d and 12d MACDs have also leveled out over the last week and are positioned for their crossovers to the buy side. If one looks closely, you can see that the short term declining tops line are being surpassed. Rumors have it off majors news items coming soon, and that's probably why the stock has well over the last three weeks, and the lows are gradually moving higher since the .13 low after the correction. My guess is .50-.75 over the next couple of weeks. Those of you who accumulated the .00s to .05s over the last year should be smiling now. But the real move is yet to come. GLTA


