Posted On: 01/28/2014 12:35:33 AM
Post# of 338556

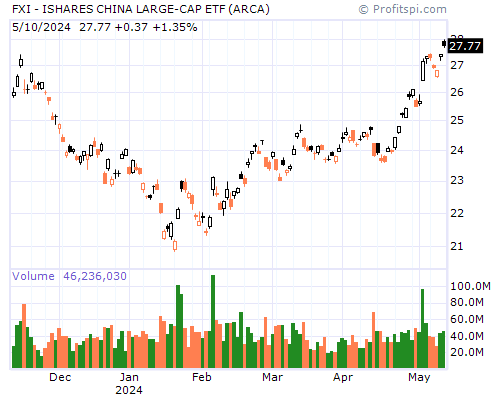
FXI Stock Chart and Technical Analysis - Mon, Jan 27th, 2014 $FXI
Period Moving Average Price Change Percent Change Average Volume
5 Day 35.17 -1.64 -4.58% 33,227,000
20 Day 36.23 -3.48 -9.25% 24,359,871
50 Day 37.79 -2.74 -7.43% 23,092,125
100 Day 37.78 -2.07 -5.71% 21,130,074
200 Day 36.53 -2.11 -5.82% 19,750,041
Year to Date 35.89 -4.21 -10.97% 26,759,383
Period Raw Stochastic Stochastic %K Stochastic %D Average True Range
9 Day 7.72% 3.90% 26.80% 0.78
14 Day 7.72% 3.78% 13.80% 0.73
20 Day 4.75% 2.30% 10.78% 0.70
50 Day 3.30% 1.57% 6.46% 0.65
100 Day 3.30% 2.64% 11.47% 0.63
Period Relative Strength Percent R Historic Volatility MACD Oscillator
9 Day 29.27% 92.28% 30.13% -1.09
14 Day 32.80% 92.28% 28.45% -1.27
20 Day 35.70% 95.25% 27.82% -1.77
50 Day 42.95% 96.70% 26.88% -3.33
100 Day 46.48% 96.70% 22.58% -3.31