Posted On: 01/28/2014 12:35:08 AM
Post# of 338556

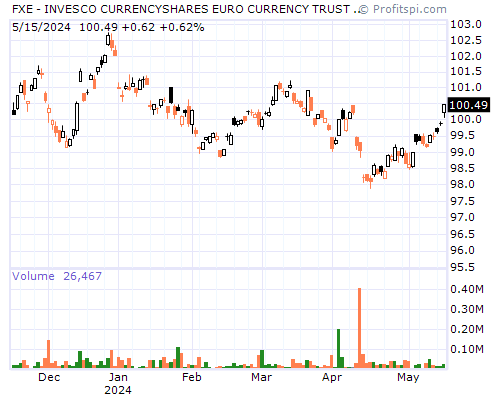
FXE Stock Chart and Technical Analysis - Mon, Jan 27th, 2014 $FXE
Period Moving Average Price Change Percent Change Average Volume
5 Day 134.71 +1.47 +1.10% 458,420
20 Day 134.87 -0.23 -0.17% 502,620
50 Day 134.76 +2.25 +1.69% 480,632
100 Day 134.23 +4.72 +3.62% 421,429
200 Day 132.19 +5.29 +4.07% 460,112
Year to Date 134.66 -0.85 -0.63% 532,553
Period Raw Stochastic Stochastic %K Stochastic %D Average True Range
9 Day 85.48% 90.13% 67.83% 0.60
14 Day 85.48% 90.13% 66.86% 0.61
20 Day 51.17% 53.96% 40.39% 0.62
50 Day 64.73% 66.75% 60.13% 0.65
100 Day 77.31% 78.52% 72.66% 0.70
Period Relative Strength Percent R Historic Volatility MACD Oscillator
9 Day 55.00% 14.52% 7.72% +0.61
14 Day 52.84% 14.52% 6.63% +0.58
20 Day 52.24% 48.83% 6.94% +0.35
50 Day 52.71% 35.27% 5.72% +0.46
100 Day 52.68% 22.69% 6.24% +1.00