Posted On: 01/28/2014 12:22:51 AM
Post# of 338556

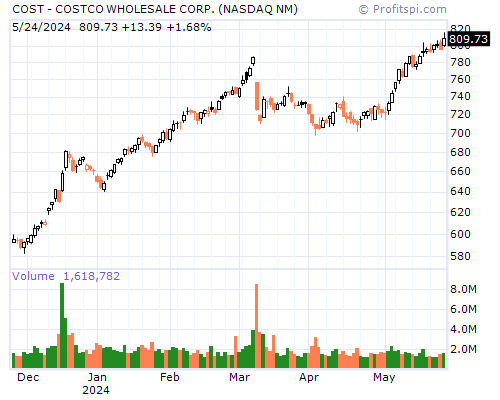
COST Stock Chart and Technical Analysis - Mon, Jan 27th, 2014 $COST
Period Moving Average Price Change Percent Change Average Volume
5 Day 113.34 -3.21 -2.76% 2,756,080
20 Day 115.99 -5.55 -4.68% 2,461,740
50 Day 119.35 -9.37 -7.65% 2,111,148
100 Day 118.30 +1.10 +0.98% 1,962,400
200 Day 115.21 +7.07 +6.67% 1,795,814
Year to Date 115.50 -5.94 -4.99% 2,720,294
Period Raw Stochastic Stochastic %K Stochastic %D Average True Range
9 Day 23.63% 11.26% 8.00% 1.60
14 Day 16.16% 8.35% 6.61% 1.62
20 Day 14.89% 7.69% 6.24% 1.62
50 Day 8.17% 4.19% 3.24% 1.60
100 Day 18.35% 15.78% 18.66% 1.58
Period Relative Strength Percent R Historic Volatility MACD Oscillator
9 Day 36.40% 76.37% 13.23% -1.89
14 Day 37.25% 83.84% 23.47% -2.48
20 Day 38.71% 85.11% 20.06% -3.32
50 Day 44.98% 91.83% 15.33% -6.68
100 Day 49.19% 81.65% 15.79% -5.63