Posted On: 01/28/2014 12:22:29 AM
Post# of 338556

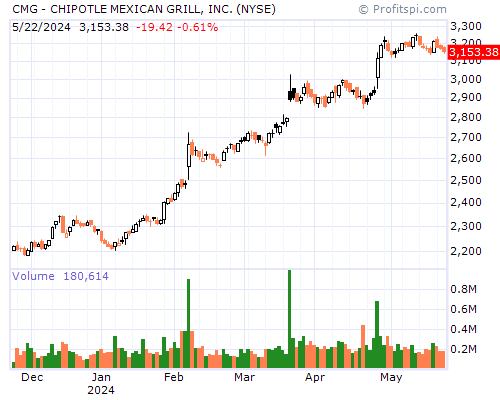
CMG Stock Chart and Technical Analysis - Mon, Jan 27th, 2014 $CMG
Period Moving Average Price Change Percent Change Average Volume
5 Day 505.35 -38.30 -7.26% 705,800
20 Day 525.12 -46.12 -8.61% 446,385
50 Day 526.39 -46.11 -8.61% 352,576
100 Day 494.07 +84.41 +20.85% 391,240
200 Day 436.59 +157.98 +47.68% 407,609
Year to Date 523.93 -43.47 -8.16% 484,053
Period Raw Stochastic Stochastic %K Stochastic %D Average True Range
9 Day 12.49% 9.49% 8.86% 11.27
14 Day 10.10% 8.35% 8.92% 10.46
20 Day 10.10% 8.35% 10.58% 9.94
50 Day 9.78% 8.05% 15.00% 8.94
100 Day 58.45% 62.41% 68.98% 8.48
Period Relative Strength Percent R Historic Volatility MACD Oscillator
9 Day 16.92% 87.51% 13.49% -21.19
14 Day 25.97% 89.90% 16.98% -28.11
20 Day 33.30% 89.90% 17.01% -30.04
50 Day 48.93% 90.22% 16.79% -31.31
100 Day 54.37% 41.55% 29.02% +1.01