Posted On: 01/01/2014 5:06:44 PM
Post# of 2561

BRCM Daily Chart ~ Continuing the Breakout
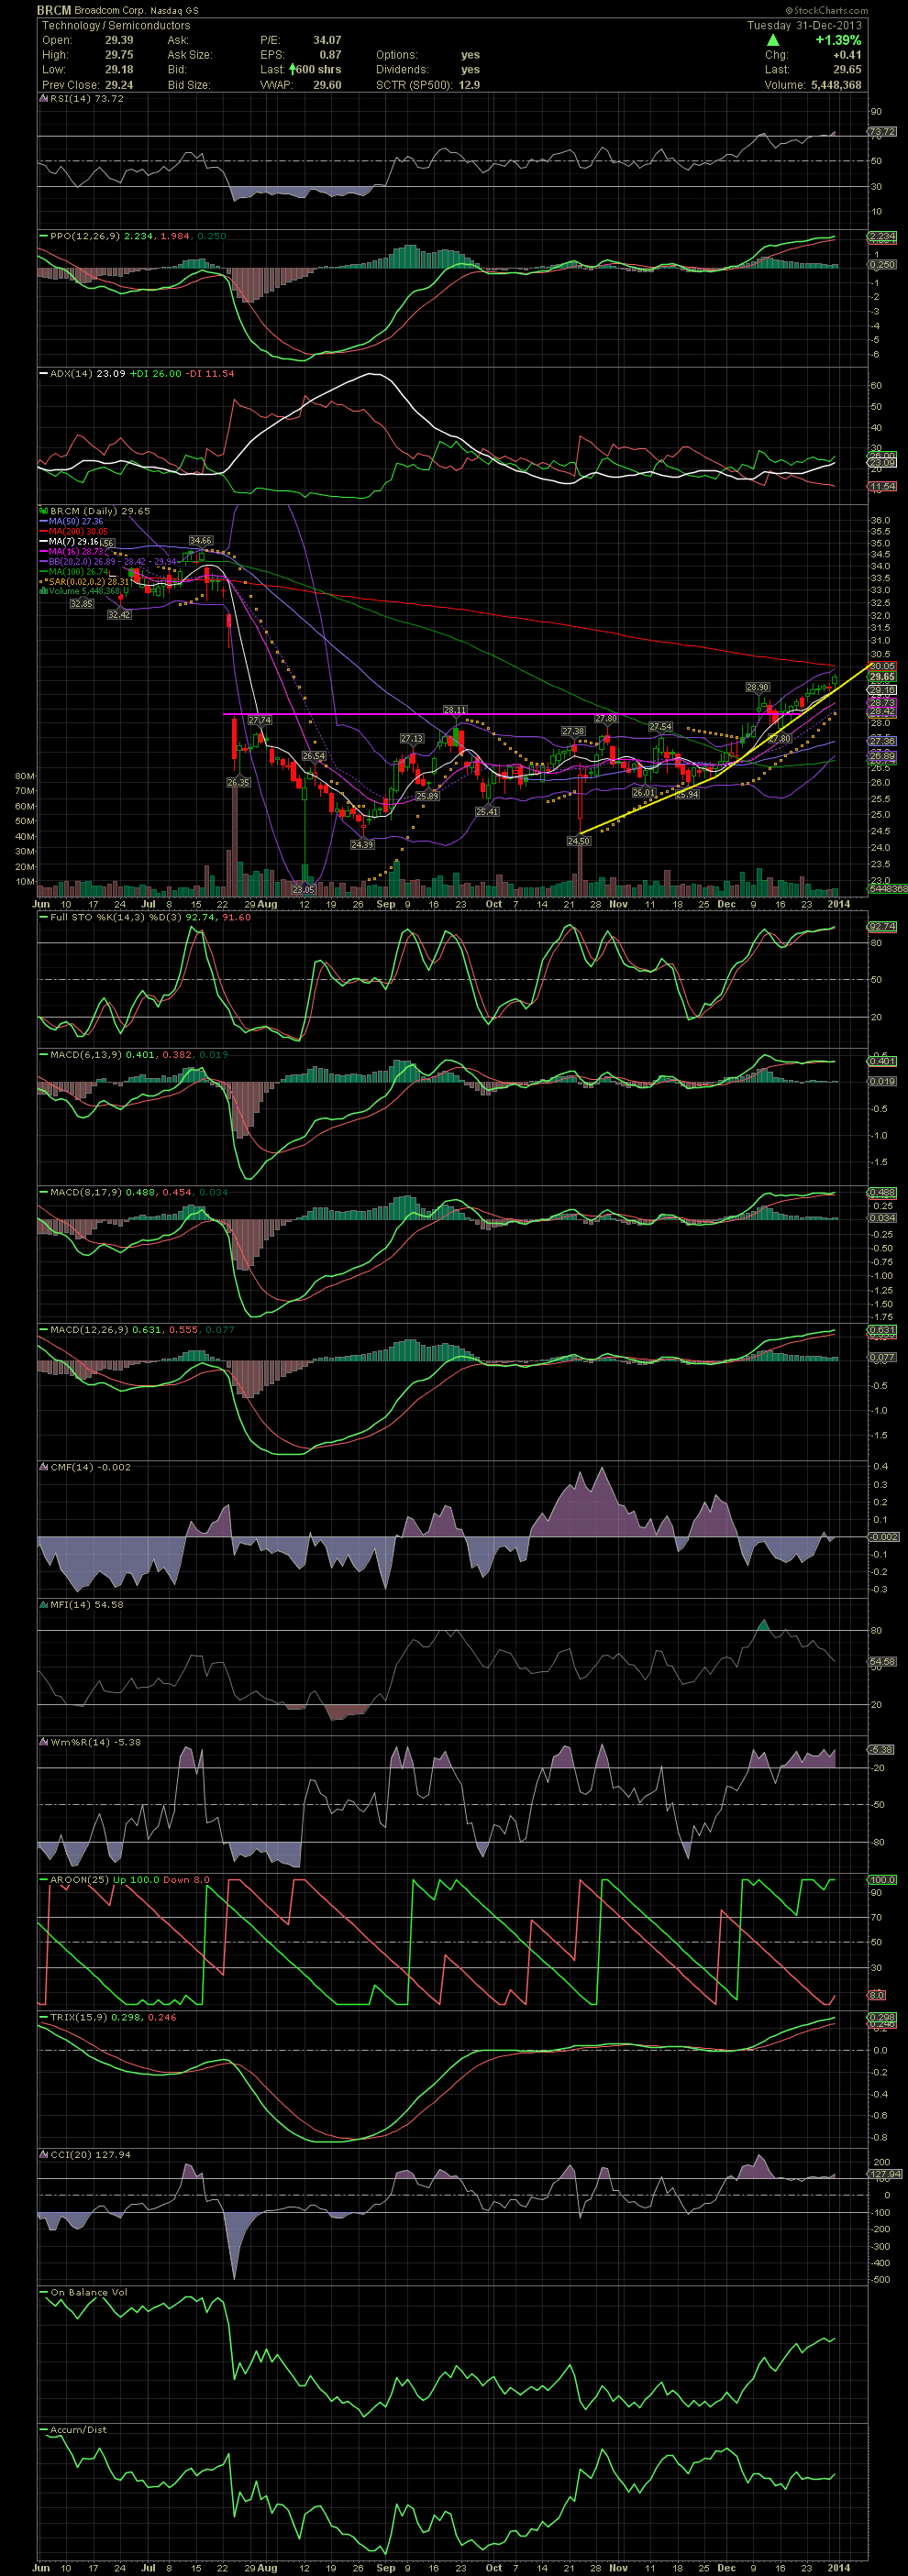
I shared BRCM a few weeks back when the stock was channeling between the 25.00s and mid to high 27.00s. The entries near 25.00 are beginning to look good now with the stock trading just under 30.00. I mentioned that a break of the horizontal resistance line on the chart needed to be broken in order to begin closing the gap to 31.00-33.00 area. Just ahead is the MA200, certainly a moving average to keep your eyes on. I'm liking this on for more upside. GLTA

I shared BRCM a few weeks back when the stock was channeling between the 25.00s and mid to high 27.00s. The entries near 25.00 are beginning to look good now with the stock trading just under 30.00. I mentioned that a break of the horizontal resistance line on the chart needed to be broken in order to begin closing the gap to 31.00-33.00 area. Just ahead is the MA200, certainly a moving average to keep your eyes on. I'm liking this on for more upside. GLTA

