Posted On: 01/01/2014 4:58:27 PM
Post# of 2561

APPY Daily Chart ~ Still Attempting to Break to New Highs
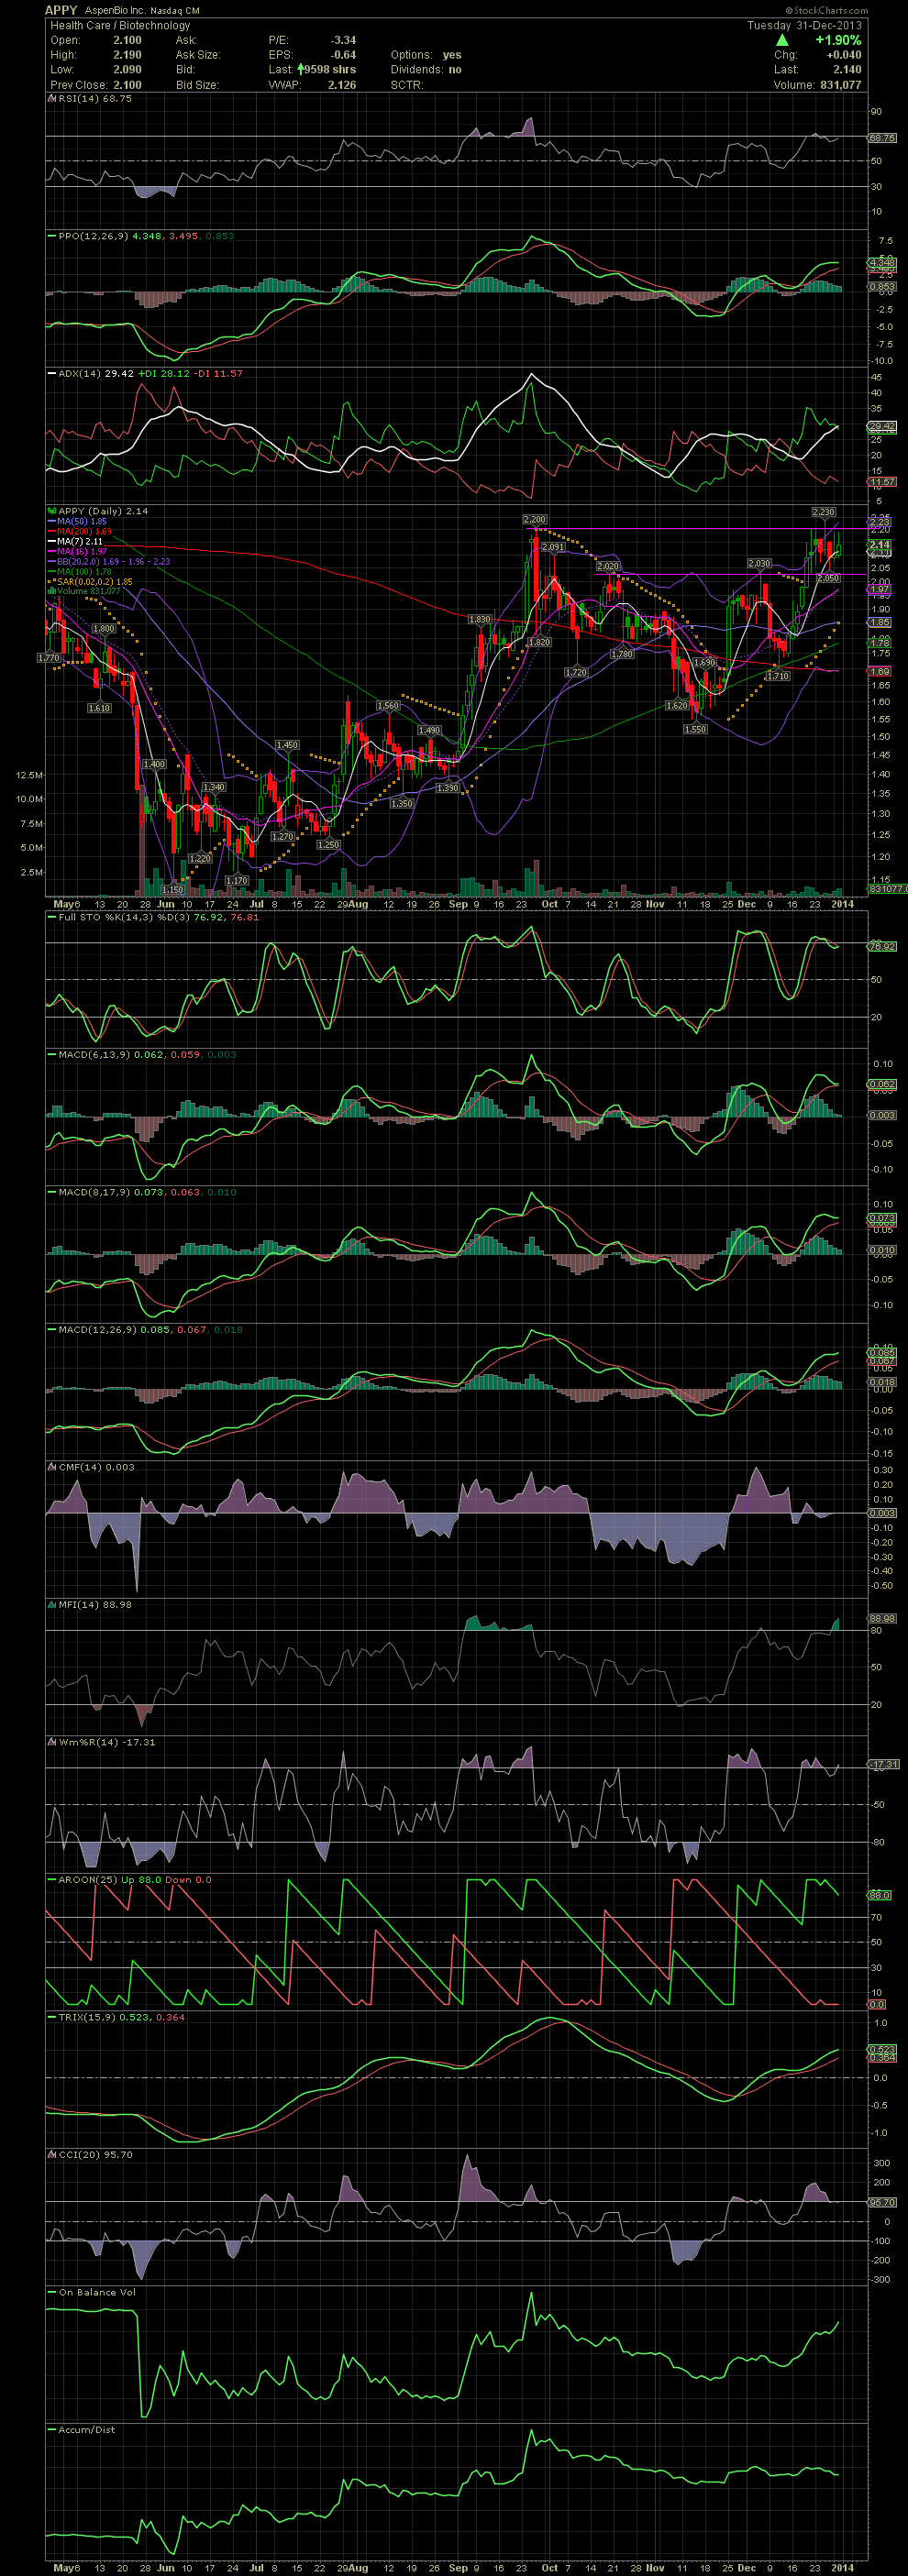
Still in APPY since the 1.70s and hoping for an imminent break above the 2.20 level. As one can see on the chart, the recent trading range of the stock has been contained within a channel of 2.02 and 2.23. The Weekly Chart shows that a break above 2.20 could bring into play a test of 2.65 to 3.17. Should the stock begin moving over this level, I'll begin posting a Weekly to better give us some potential longer term targets. For now, APPY is a hold for me. GLTA

Still in APPY since the 1.70s and hoping for an imminent break above the 2.20 level. As one can see on the chart, the recent trading range of the stock has been contained within a channel of 2.02 and 2.23. The Weekly Chart shows that a break above 2.20 could bring into play a test of 2.65 to 3.17. Should the stock begin moving over this level, I'll begin posting a Weekly to better give us some potential longer term targets. For now, APPY is a hold for me. GLTA

