Posted On: 11/24/2013 6:13:08 PM
Post# of 2561

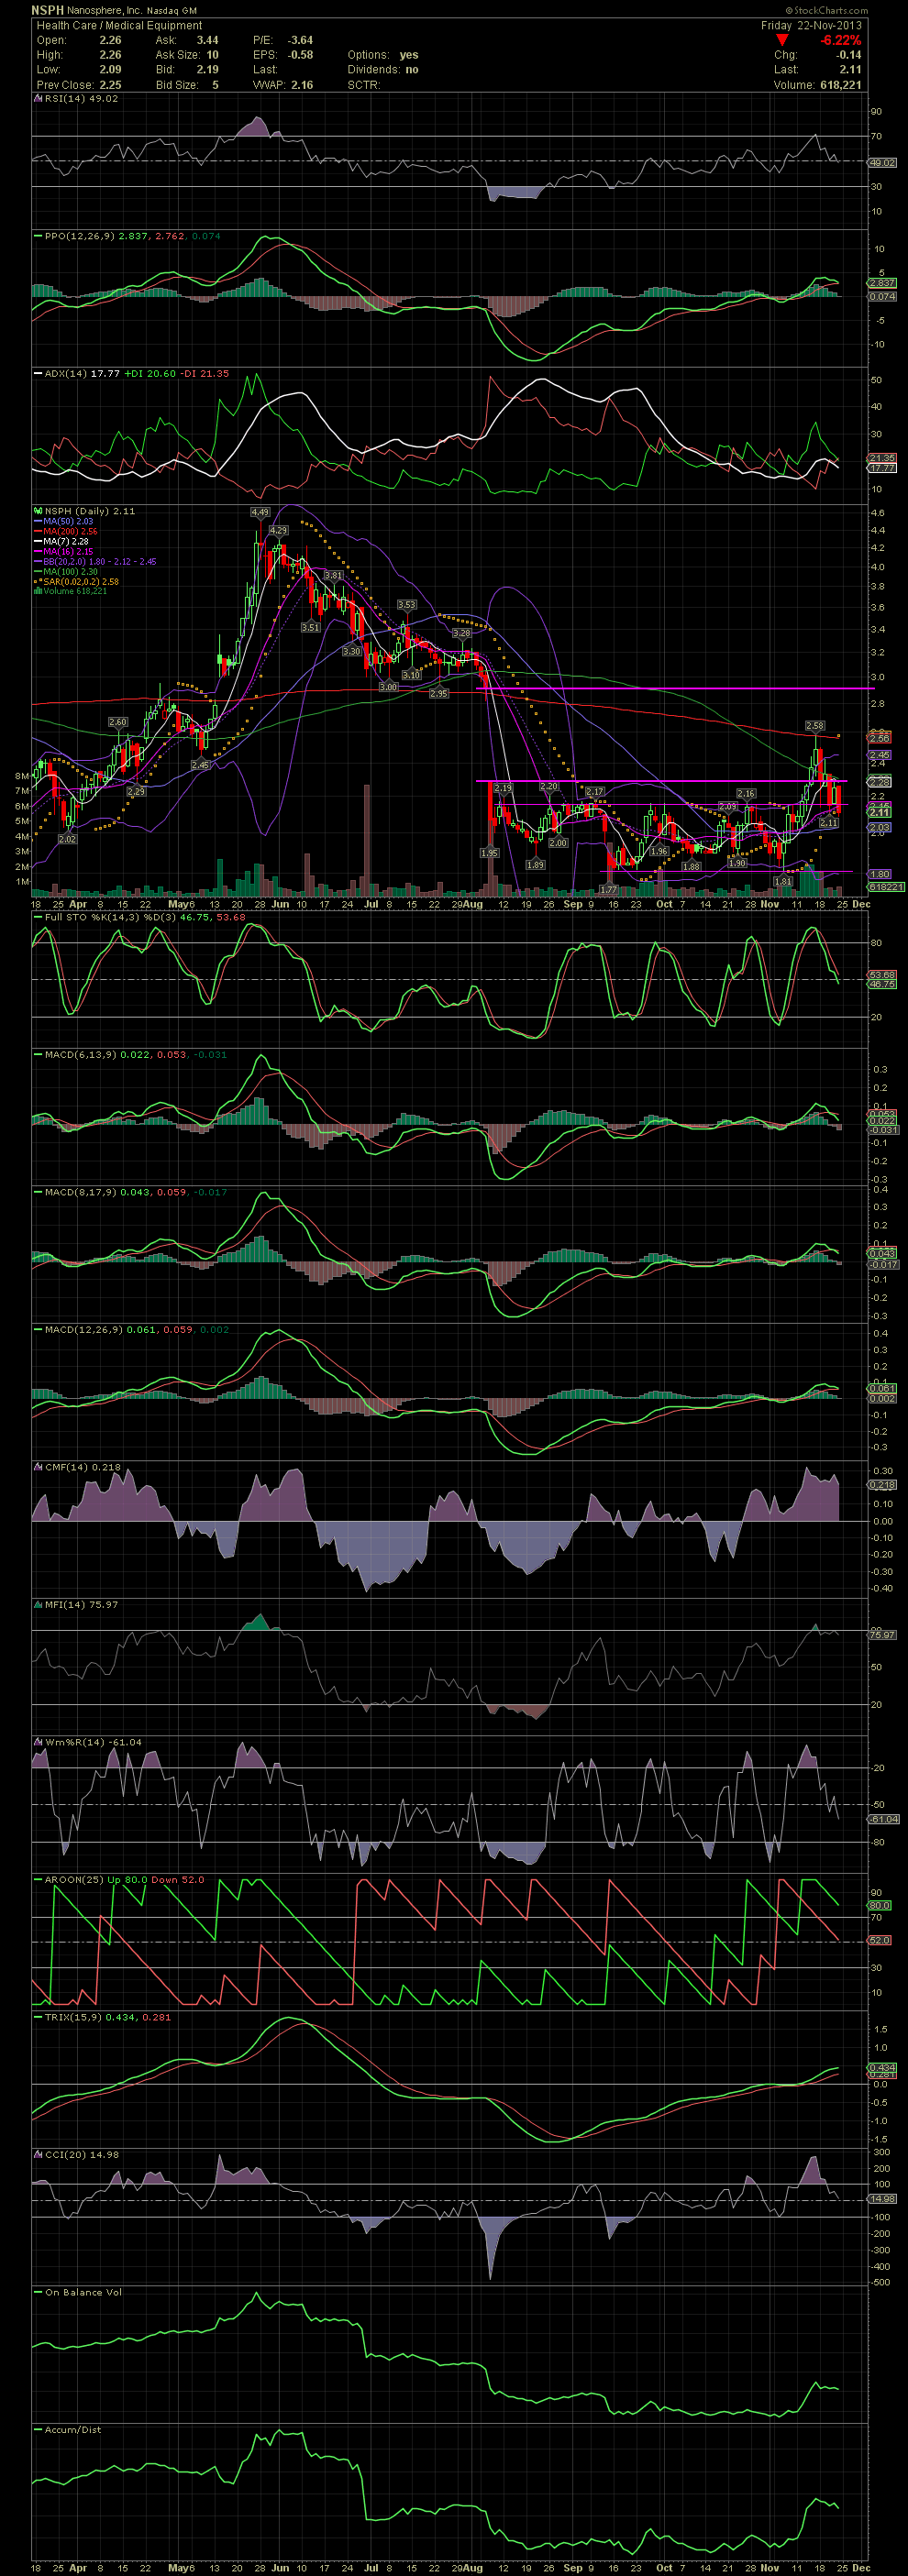
NSPH Daily Chart ~ Looks Like More Downside Since Our Exit After Hitting the MA200 at 2.58
The support level in the 2.15 area was broken to the downside on Friday. We traded out of the stock in the 2.40-2.50s when the stock traded outside the upper bollie and slammed into the MA200 at 2.58. Now we wait until the chart resets. The MA50 is at 2.03, but should that not hold, then NSPH could easily slip back into the multi week trading channel that it was previously in, from 1.80s to 2.15/2.17. GLTA
The support level in the 2.15 area was broken to the downside on Friday. We traded out of the stock in the 2.40-2.50s when the stock traded outside the upper bollie and slammed into the MA200 at 2.58. Now we wait until the chart resets. The MA50 is at 2.03, but should that not hold, then NSPH could easily slip back into the multi week trading channel that it was previously in, from 1.80s to 2.15/2.17. GLTA