Posted On: 11/24/2013 6:08:29 PM
Post# of 2561

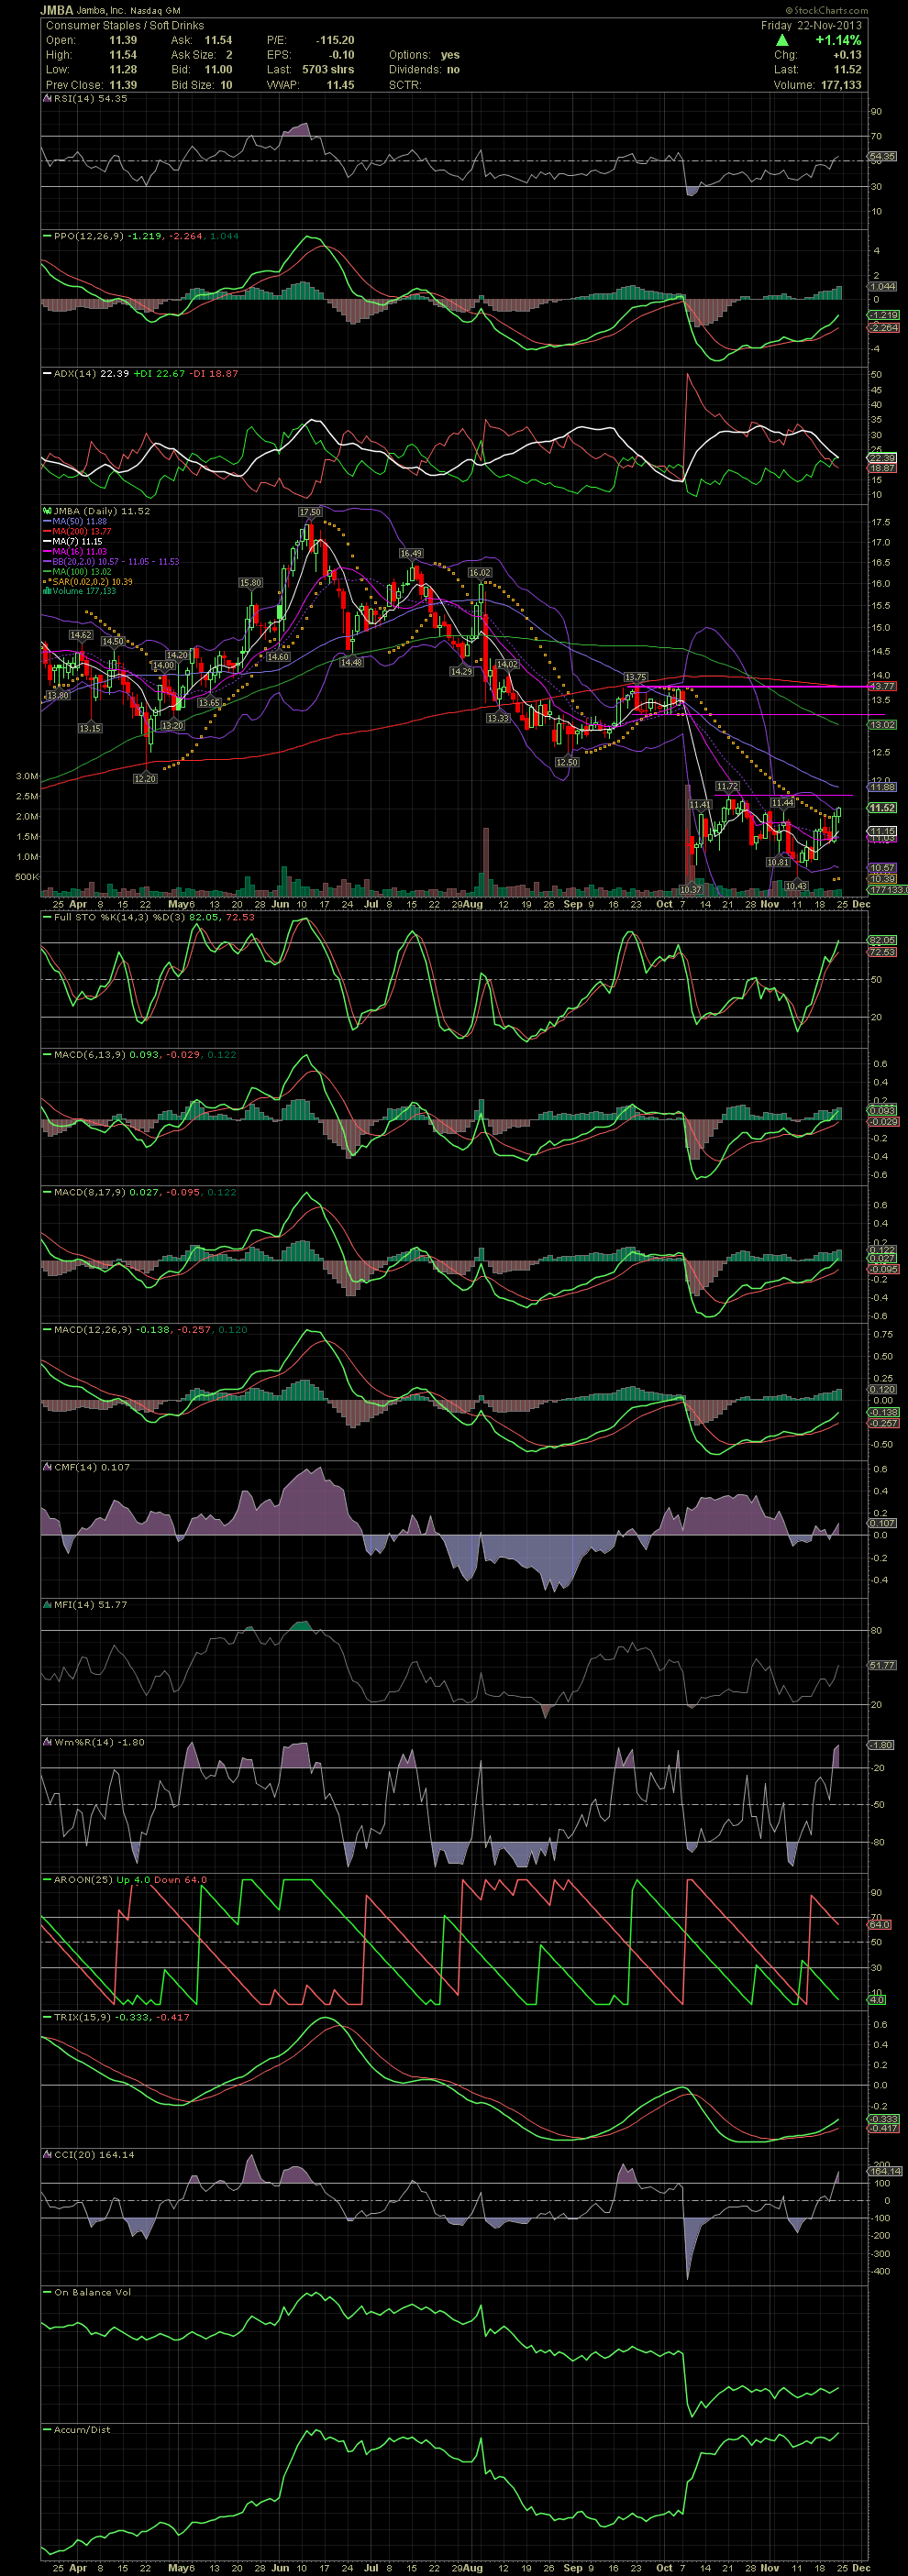
JMBA Daily Chart ~ Moving up from Its Double Bottom at the $10.40 Level
JMBA continues to trend up. The key level of resistance that I mentioned last week is 11.72. A break above that level with volume would suggest the beginning of an attempt to close the gap just over 13.00. GLTA
JMBA continues to trend up. The key level of resistance that I mentioned last week is 11.72. A break above that level with volume would suggest the beginning of an attempt to close the gap just over 13.00. GLTA