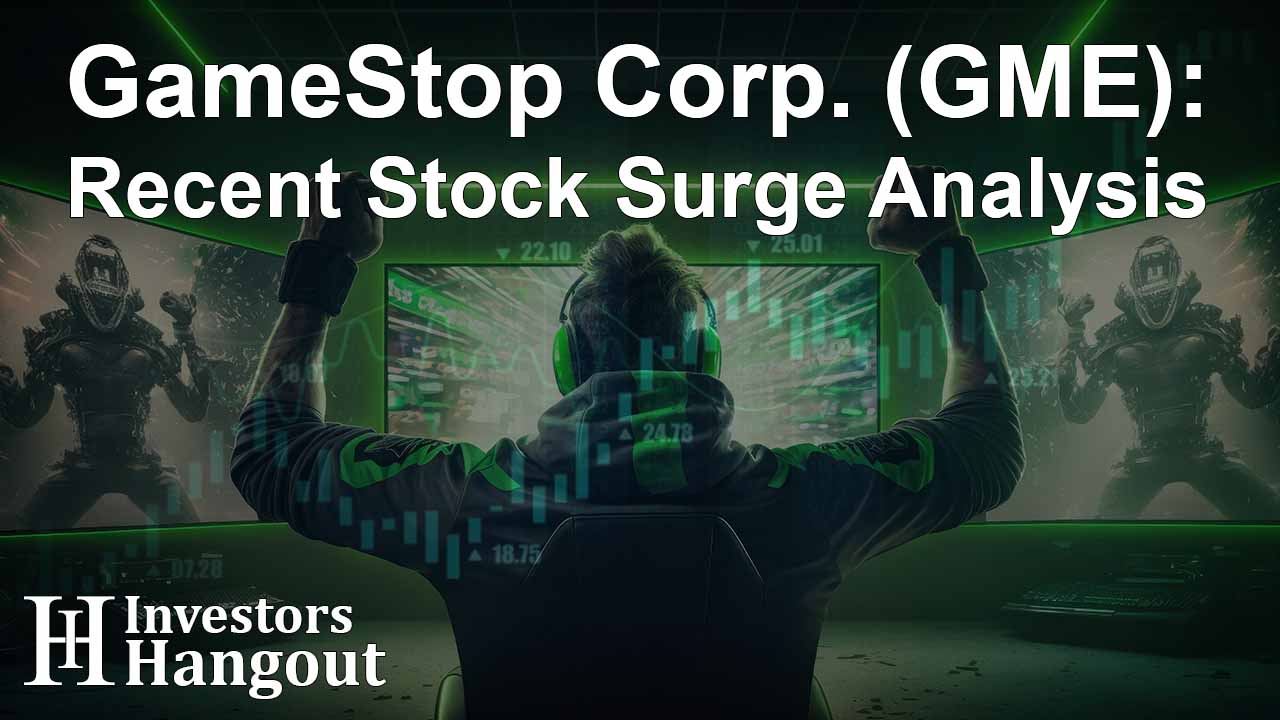
Introduction
GameStop Corp. (NYSE: GME), a specialty retailer known for its gaming products and collectibles, has recently experienced a significant surge in its stock price. This post aims to dissect the reasons behind this increase, providing a comprehensive look at the company's profile, recent news, technical analysis, and other relevant information.
Company Profile
GameStop Corp., headquartered in Grapevine, Texas, operates as a retailer for games and entertainment products through its various stores and e-commerce platforms across the United States, Canada, Australia, and Europe. The company, founded in 1996, has been a staple in the gaming industry, offering new and pre-owned gaming platforms, accessories, software, and digital items. It also deals in collectibles related to pop culture and technology, operating under brands like GameStop, EB Games, Micromania, and Zing Pop Culture.
Recent News and Developments
GameStop's stock price has seen a 10% increase on a recent Friday, with a high of $20.20 and a closing price of $19.81. This surge was accompanied by a 97% spike in trading volume, indicating heightened investor interest. Analysts have made notable changes in their ratings, with Wedbush lowering its price objective from $6.00 to $5.60 and maintaining an "underperform" rating, while StockNews.com upgraded the stock from a "sell" to a "hold" rating.
Financial Averages and Ratios
GameStop's financial health is a mixed bag. The company's fifty-day moving average stands at $12.99, and its two-hundred-day moving average is at $14.08. It boasts a low debt-to-equity ratio of 0.01, a quick ratio of 1.44, and a current ratio of 2.11. However, the market cap of $5.35 billion and a sky-high price-to-earnings ratio of 873.44 raise eyebrows, suggesting a valuation that is not in line with its earnings.
Quarterly Earnings Results
The company reported $0.22 earnings per share for the quarter, missing the consensus estimate of $0.29 by $0.07. Quarterly revenue was $1.79 billion, below analyst estimates of $2.05 billion, and down 19.4% compared to the same quarter last year. These figures reflect the challenges GameStop faces in a rapidly evolving retail landscape.
Insider Transactions and Institutional Investors' Activity
Insider transactions have seen General Counsel Mark Haymond Robinson and Insider Daniel William Moore selling shares at average prices of $11.61 and $10.20, respectively. Institutional investors have been adjusting their stakes, with some increasing their holdings, indicating a belief in the company's potential or strategic positioning for other reasons.
Technical Analysis
GameStop's stock has formed a bull flag and a quadruple inside bar pattern, suggesting bullish sentiment among traders. Resistance levels are identified at $18.58 and $20.10, with support between $16.20 and $13.36. The relative strength index (RSI) is around 75, indicating the stock may be oversold.
Short Interest
GameStop's short interest is below the 20% threshold considered very high, with a negative change of -8.74%. This decrease in short interest could be a factor in the stock's recent price increase, as it suggests a reduction in bearish sentiment.
Future Outlook
Analysts have a bearish sentiment on GameStop, with expectations of declining revenue and earnings. The company's financials have been deteriorating, with a decrease in net sales and gross profit. Despite historical growth, the future performance is not viewed optimistically by analysts.
Profitability and Valuation
GameStop's asset turnover ratio is higher than the industry average, but its gross profit margin is lower. The stock's valuation is mixed, with some metrics indicating undervaliation and others showing overvaluation compared to industry averages.
POWR Ratings and Analyst Recommendations
GameStop has an overall POWR Rating of C (Neutral) and is ranked #36 out of 41 in the Specialty Retailers industry. Analysts recommend considering other A-rated or B-rated stocks in the industry instead of GameStop.
Technical Analysis of GameStop Corp. (GME)
GameStop Corp. (GME) has been a subject of intense scrutiny and volatility in the stock market. Let's break down the technical analysis to understand the recent price movements and what they might suggest for the stock's future trajectory.
Price Action
GameStop's stock price has experienced a notable increase, with a recent surge of 10% on a particular Friday, reaching a high of $20.20 and closing at $19.81. This movement is significant as it represents a break from previous trading sessions.
Volume Analysis
The trading volume on the day of the surge was 10,666,307 shares, which is a 97% increase from the average session volume of 5,409,320 shares. This substantial increase in volume could indicate strong buying interest and might be a precursor to further price movements.
Moving Averages
-
Fifty-day moving average (MA): $12.99
-
Two-hundred-day MA: $14.08
The stock is currently trading above both its fifty-day and two-hundred-day moving averages, which is typically a bullish signal. The fifty-day MA crossing above the two-hundred-day MA could be considered a "golden cross," a bullish indicator for long-term momentum.
Bollinger Bands
The Bollinger Bands for GME show the following:
-
Upper Band: $11.84
-
Middle Band: $10.82
-
Lower Band: $9.81
The stock price closing near the upper band suggests that GME is in the higher price range compared to its recent price action and could be overbought. Traders often look for signs of a pullback when the price hits the upper band.
MACD (Moving Average Convergence Divergence)
The MACD is a trend-following momentum indicator that shows the relationship between two moving averages of a stock’s price. For GME:
-
MACD: -0.44
-
Signal Line: -0.64
-
Histogram: 0.2
The MACD is currently below the signal line, which is typically considered bearish. However, the histogram is positive, indicating that the negative momentum is slowing and could potentially reverse.
RSI (Relative Strength Index)
The RSI for GME is at 44.34, which is near the midpoint of the 30-70 range. An RSI value below 30 typically indicates an oversold condition, while above 70 suggests an overbought condition. GME's RSI suggests that the stock is neither overbought nor oversold at the current level.
Support and Resistance
Based on recent price action, we can identify the following levels:
-
Resistance: The recent high of $20.20 acts as a resistance level. Another resistance level to watch is $20.10, which is close to the recent high and could be a psychological barrier.
-
Support: The stock has support at $15.41 and $13.36, which are levels where the stock previously found buying interest.
Risk Management Strategies for Investing in Volatile Stocks like GME
Understand the Nature of Volatility
- Recognize that stocks like GME can experience sharp price movements within short periods.
- Volatility can be driven by factors such as market sentiment, news, social media influence, and trading volumes.
Set Clear Investment Goals
- Define your investment objectives, time horizon, and risk tolerance.
- Determine whether trading volatile stocks aligns with your long-term financial goals.
Use Stop-Loss Orders
- Implement stop-loss orders to limit potential losses.
- A stop-loss order automatically sells a security when it reaches a certain price.
Position Sizing
- Allocate only a small portion of your portfolio to high-volatility stocks to avoid significant losses.
- Diversify your investments across different sectors and asset classes to mitigate risk.
Stay Informed
- Keep up with the latest news and developments that could affect stock prices.
- Monitor company fundamentals, market trends, and technical indicators.
Avoid Emotional Trading
- Volatile stocks can test your emotions; avoid making impulsive decisions based on fear or greed.
- Stick to your trading plan and resist the urge to chase losses or jump on speculative trends.
Use Limit Orders
- Limit orders allow you to specify the price at which you are willing to buy or sell a stock.
- This can prevent unexpected executions in fast-moving markets.
Regularly Review and Adjust Your Strategy
- Periodically assess your portfolio's performance and the ongoing suitability of your investment choices.
- Be willing to adapt your strategy in response to changing market conditions.
Consider Hedging Strategies
- Options can be used to hedge against downside risk.
- Protective puts, for example, give you the right to sell a stock at a predetermined price.
Maintain Adequate Liquidity
- Ensure you have sufficient liquid assets to cover unexpected expenses without needing to sell volatile stocks during a downturn.
Seek Professional Advice
- Consult with a financial advisor to help navigate the complexities of volatile markets.
- A professional can provide personalized advice based on your individual financial situation.
Conclusion
The recent surge in GameStop's stock price can be attributed to a combination of factors, including changes in analyst ratings, a decrease in short interest, and technical patterns that suggest bullish sentiment. However, the company's financial health and future outlook present a more complex picture, with challenges in earnings and revenue growth. Investors should approach GameStop with caution, considering both the potential for short-term gains and the risks associated with its long-term prospects.
The technical analysis of GameStop Corp. (GME) suggests a mixed outlook. While the stock is trading above its moving averages and the recent surge in price and volume could indicate bullish sentiment, the MACD below the signal line and the proximity to the upper Bollinger Band may signal caution. The RSI indicates a neutral position, providing no clear overbought or oversold signals.
Investors and traders should monitor these technical indicators in conjunction with fundamental analysis and market news to make informed decisions. Given GameStop's history of volatility, it is also advisable to be prepared for potential rapid changes in the stock's price.
Investing in volatile stocks like GME requires a disciplined approach to risk management. By employing strategies such as stop-loss orders, position sizing, staying informed, and avoiding emotional trading, you can better manage the risks associated with these investments. Always align your investment choices with your overall financial plan and be prepared to adjust your strategy as market conditions change.
Join Investors Hangout
Joining Investors Hangout presents an unparalleled opportunity for both novice and seasoned investors. This platform is 100% free and furnishes members with the ability to post on stock message boards and send private messages, facilitating meaningful discussions and the exchange of valuable insights. Furthermore, Investors Hangout is a treasure trove of stock trading data, offering access to recent stock prices, comprehensive company profiles, details of recent and historical stock trades, up-to-date company news, filings, financials, buy ratings, and dynamic interactive stock charts. This wealth of information can be instrumental in making informed investment decisions and staying ahead in the fast-paced world of stock trading.
About The Author
Contact Editor privately here. Or send an email with ATTN: Editor as the subject to contact@investorshangout.com.
About Investors Hangout
Investors Hangout is a leading online stock forum for financial discussion and learning, offering a wide range of free tools and resources. It draws in traders of all levels, who exchange market knowledge, investigate trading tactics, and keep an eye on industry developments in real time. Featuring financial articles, stock message boards, quotes, charts, company profiles, and live news updates. Through cooperative learning and a wealth of informational resources, it helps users from novices creating their first portfolios to experts honing their techniques. Join Investors Hangout today: https://investorshangout.com/