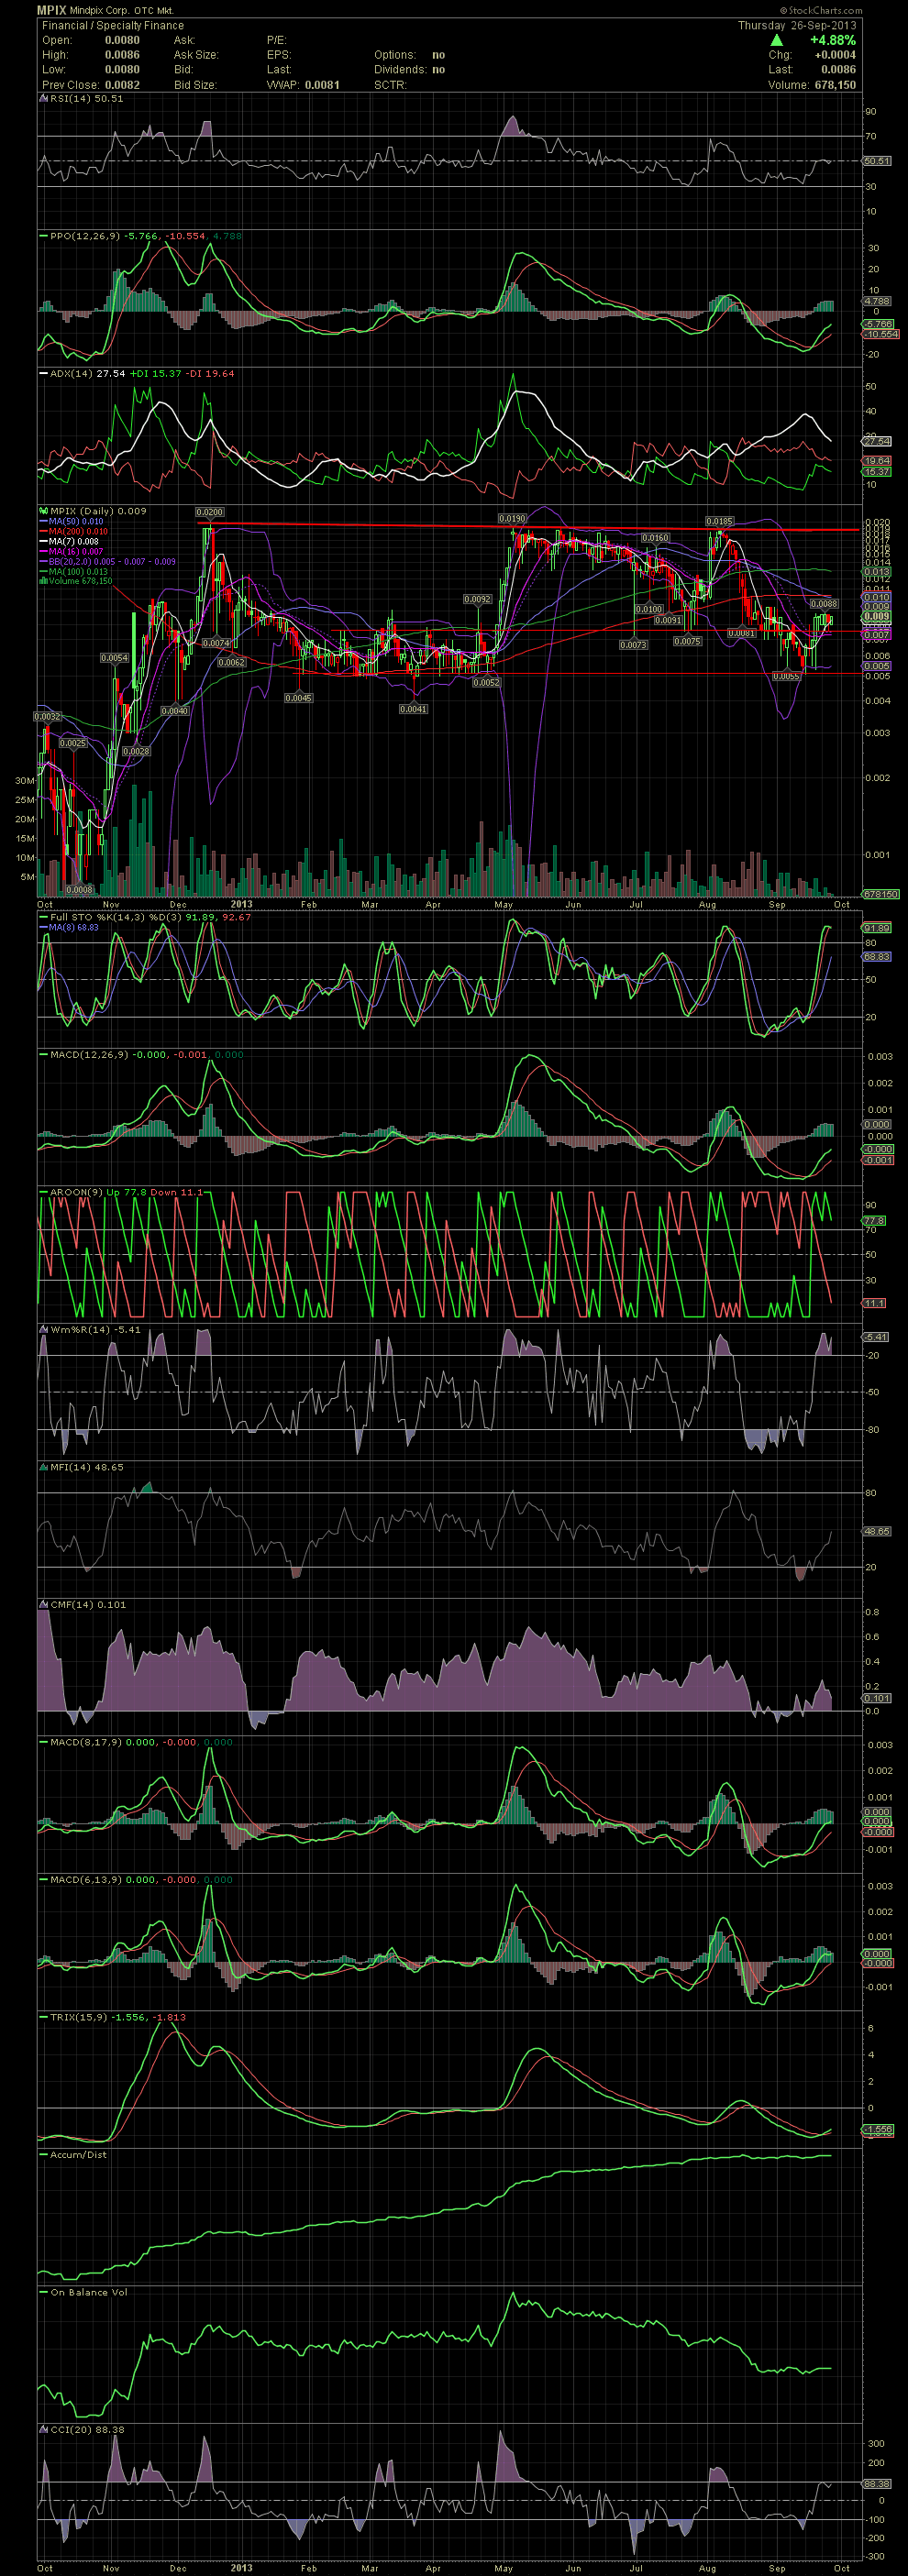
MPIX Daily Chart ~ Stock Looking Better After a On
Post# of 2561

Consolidation continues in the .0075-.0088 level after a short term bottom was put in near the .005 lows of Feb to Apr. Most indicators discussed on the MPIX board over the last couple of weeks are now in a bullish trend. The stock will need to see larger volume and get over the MA50 and MA200 at .010. Should that level be broken thru, then a test of the MA100 at .013 would be the most likely next resistance point. Fwiw, the TRIX indicator just began its crossover to the upside. Scroll down below the chart and compare the TRIX to previous crossovers and the movement in the stock when that occurred. As to getting back over .01 and potentially hitting new highs, any strong material news would be the catalyst for that to happen. GLTA

 (0)
(0) (0)
(0)