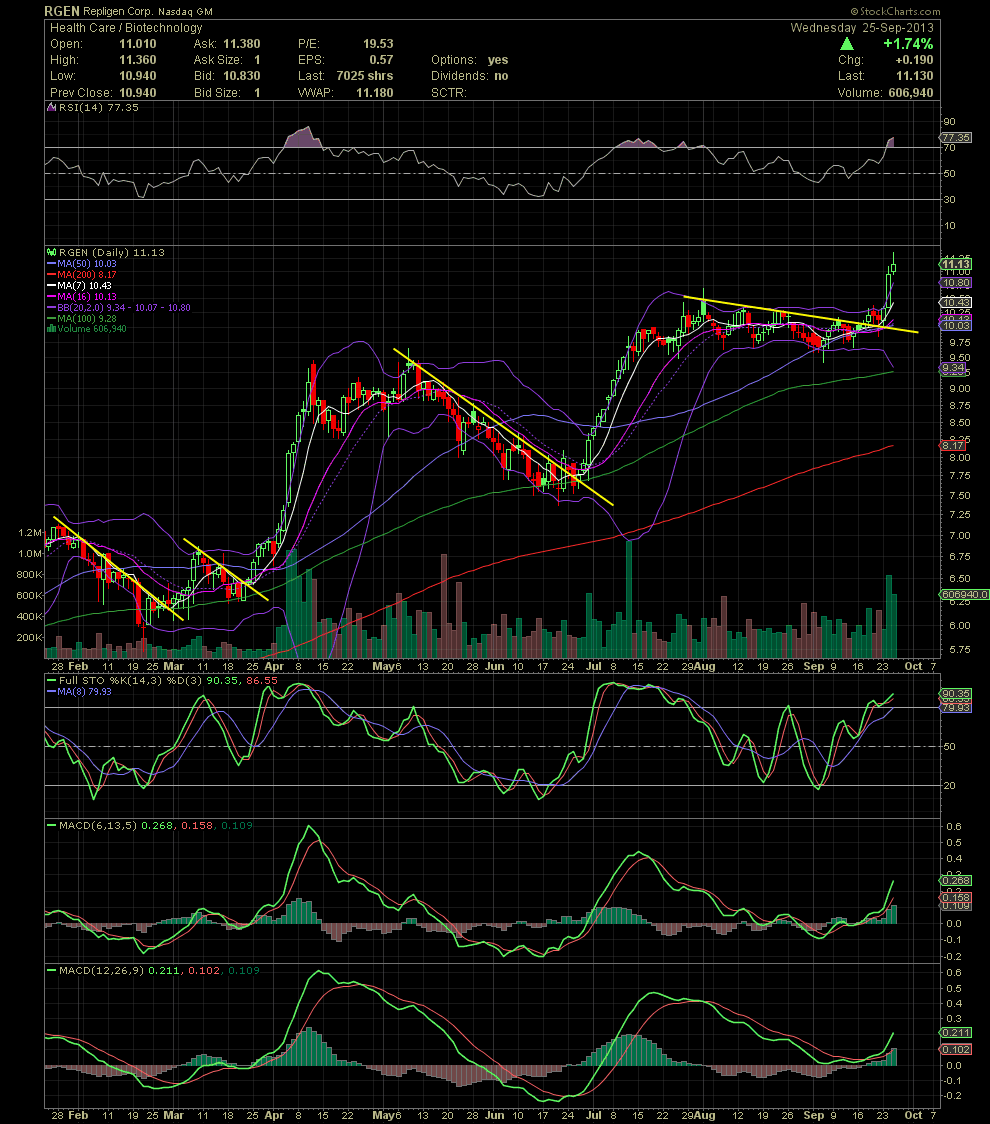
RGEN Daily Chart ~ Link Back to the Previous Chart
Post# of 2561
When RGEN first broke through its declining tops line, there was one short pullback retesting that level. The last three days has seen the stock then move from the 10.00 level to as high as 11.36 this morning. Although that's 'only' 11.36% from the breakout, that is still a very good move for a Big Board stock. The indicators are suggesting there is more ahead. GLTA

 (0)
(0) (0)
(0)