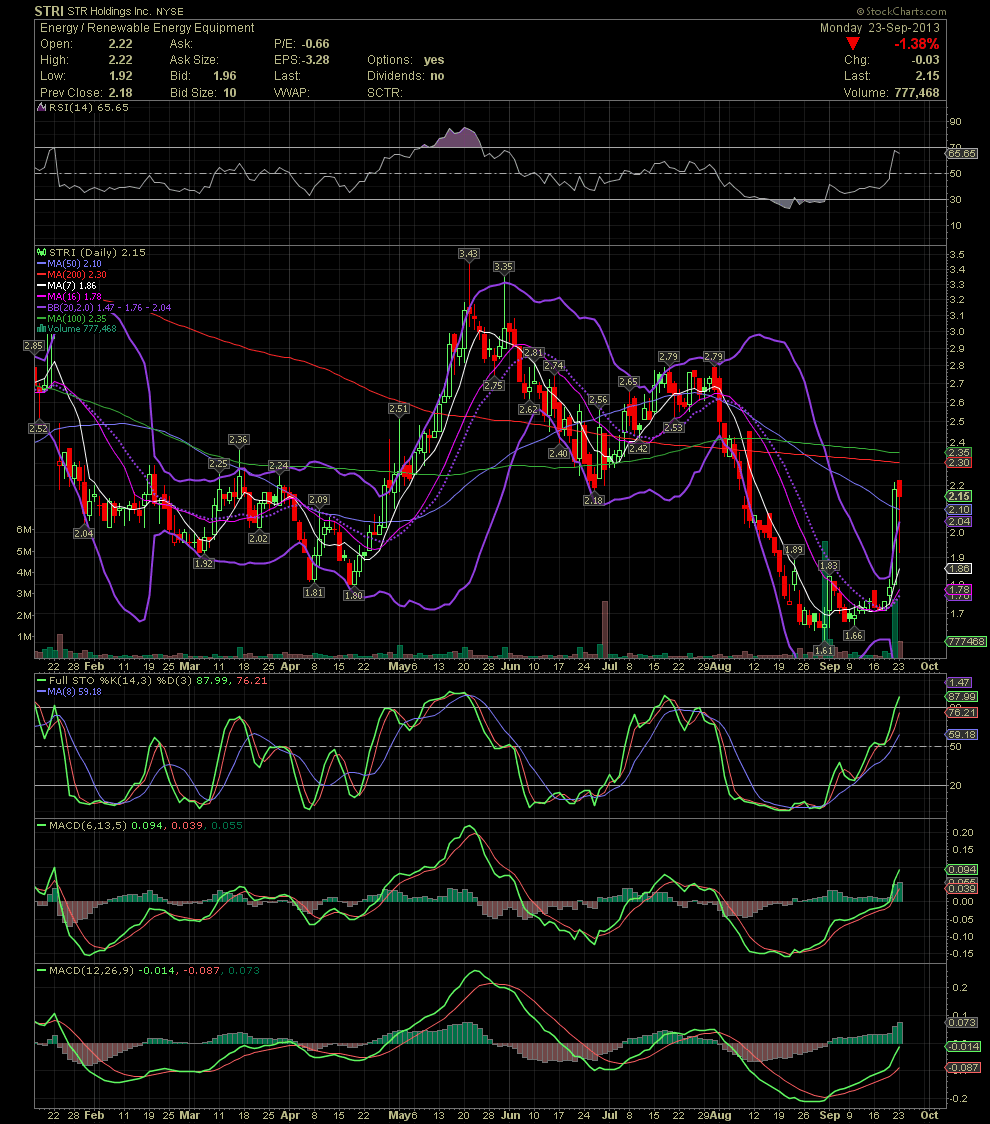
STRI Daily Chart ~ A Stock to Swing I was intr
Post# of 2561

I was introduced to this NYSE stock a few days ago, just prior to the pop from the 1.80s to 2.20. Just follow the FullSto and MACDs with STRI, and you could do fairly well. Study the trading history below. The stock has now closed above the MA50 for the second day. A possible test of the MA200 and 100 or just above at 2.30 and 2.35. Clear those two resistance points and the stock could test the previous double top of 2.79.

 (0)
(0) (0)
(0)