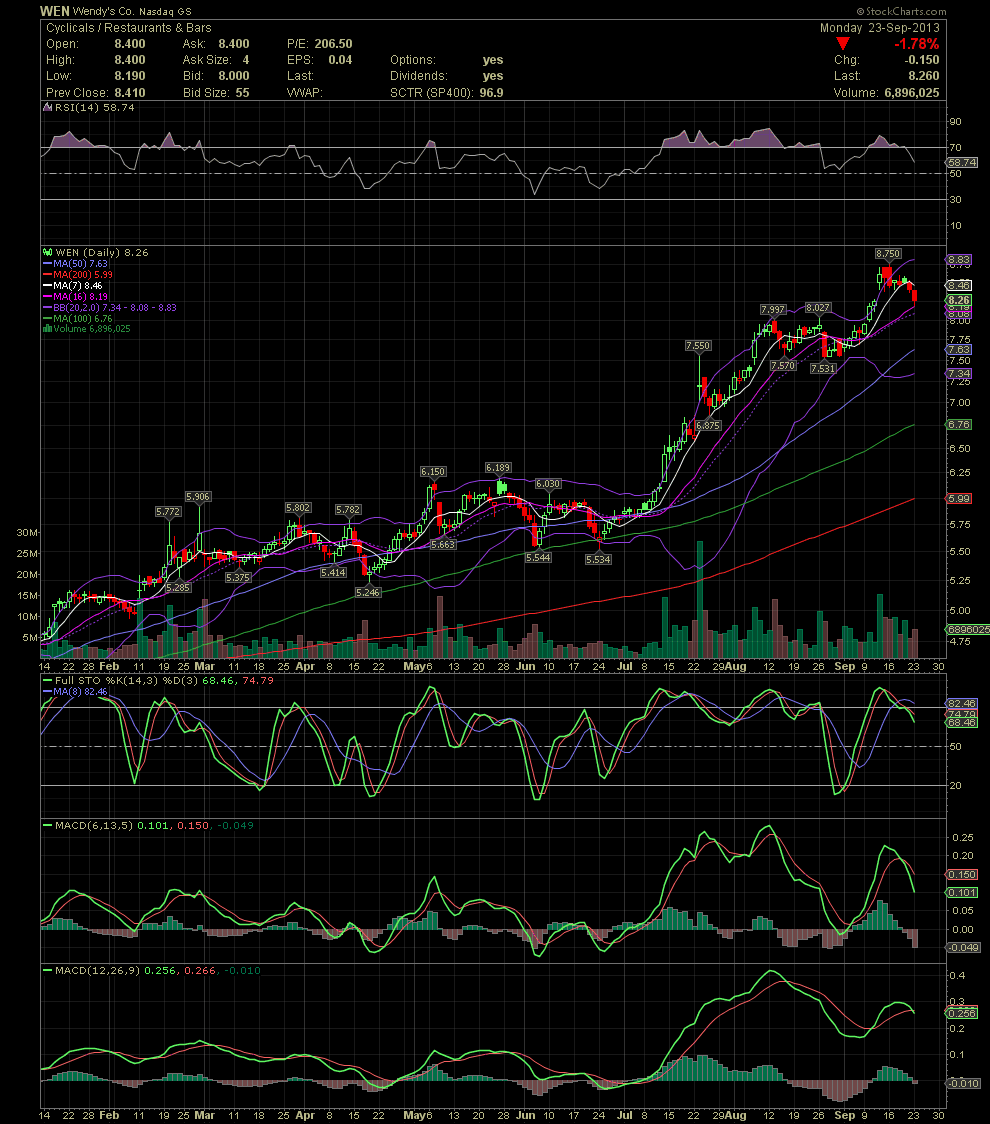
WEN Daily Chart ~ Correction Which Began Last Week
Post# of 2561

A couple of friends asked me to post a chart of WEN. Wendy's has been a good one to swing trade for those using the charts, like the one below. Now the question is whether WEN will hold the MA16 or 20 and bounce, or does the stock continue to correct. No one knows but the FullSto and MACDs are suggesting further downside as they crossed to the downside over the last few days. Should the two MAs at 8.19 and 8.08, which also happens to be near the highs in August, fail, I would be looking for the next level of support near the previous lows in the 7.50s or the MA50.

 (0)
(0) (0)
(0)