MPIX Daily Chart ~ Reversal Underway Since the M
Post# of 5570
Posted On: 09/23/2013 11:56:04 PM

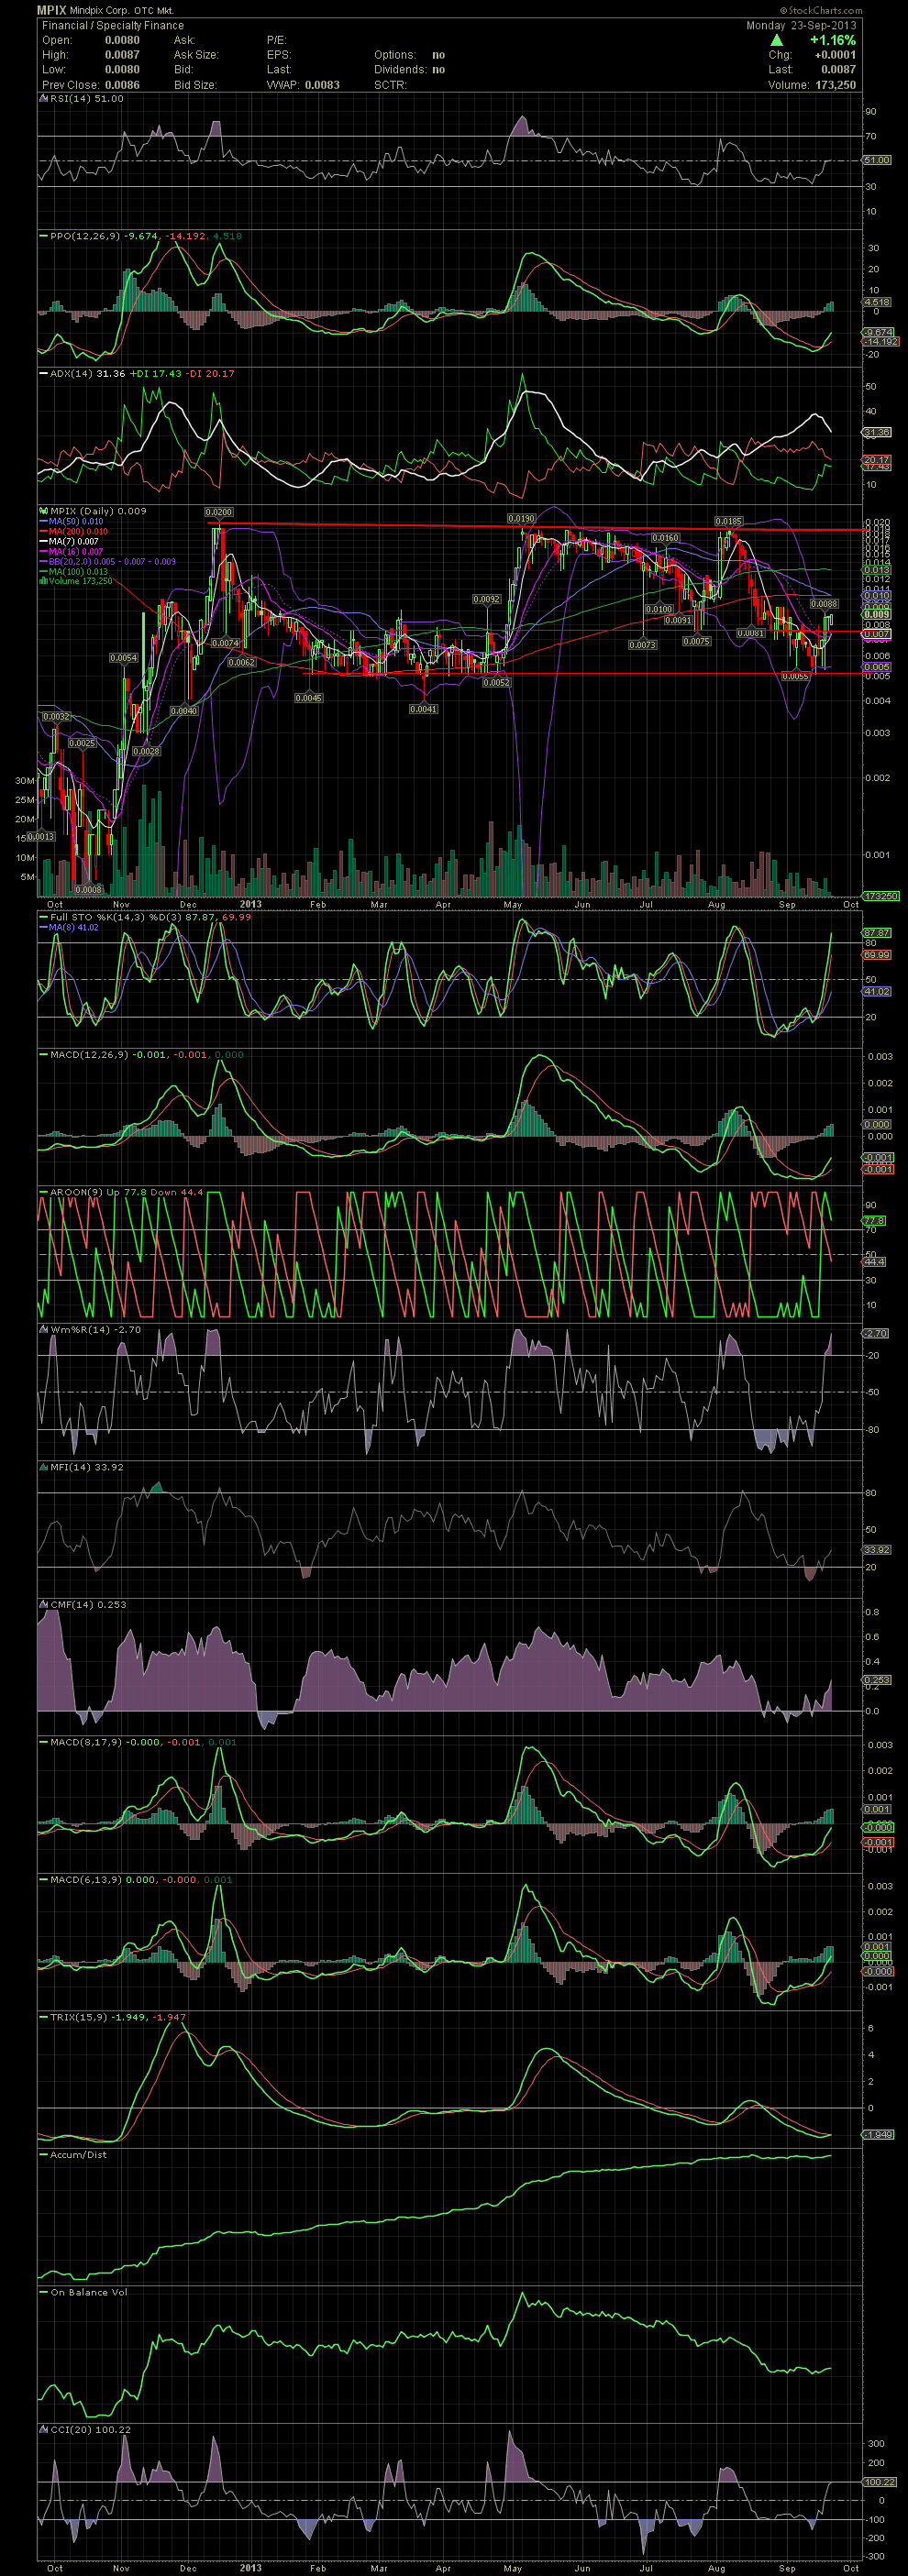
MPIX Daily Chart ~ Reversal Underway
Since the MPIX board had over 1600 views today, I thought I'd leave you with a chart. As always, charts are tools to better assist anyone, who understands technicals, with their entries and exits. For those holding for the longer term, it really doesn't matter what the MPIX chart looks like, as you are more than likely here because of the belief in Victor Siegel, Saul Federman, and the entire MPIX team to include shareholders.
Here is a one year chart. I'll post a six month chart next so you can see the various moving averages easier. As mentioned a couple of times over the last two weeks, the indicators were beginning to bottom out at fairly oversold conditions. Just scroll down the right portion of the chart and notice that things turned positive anywhere from 2 days to one week prior to the move from the .005s to the current high .008s. Every indicator has responded with a move up from their oversold conditions. The question now, with today's extremely low volume, would be 'Is the seller(s) finally done?' No one would know that other than those that have been pounding the bids for weeks. It should have been obvious to anyone that has been following the charts the last few weeks, MPIX had good support in the low .005s. I've had the same horizontal support lines on the chart below for months. The first line of support, at the mid .007s, didn't hold. But the lower support level of the .005 area did hold. As in the past, MPIX will need volume to continue a move up. Should the supply be less than the demand, up we go, especially on any material news. We'll see soon. GLTA
 (0)
(0) (0)
(0)