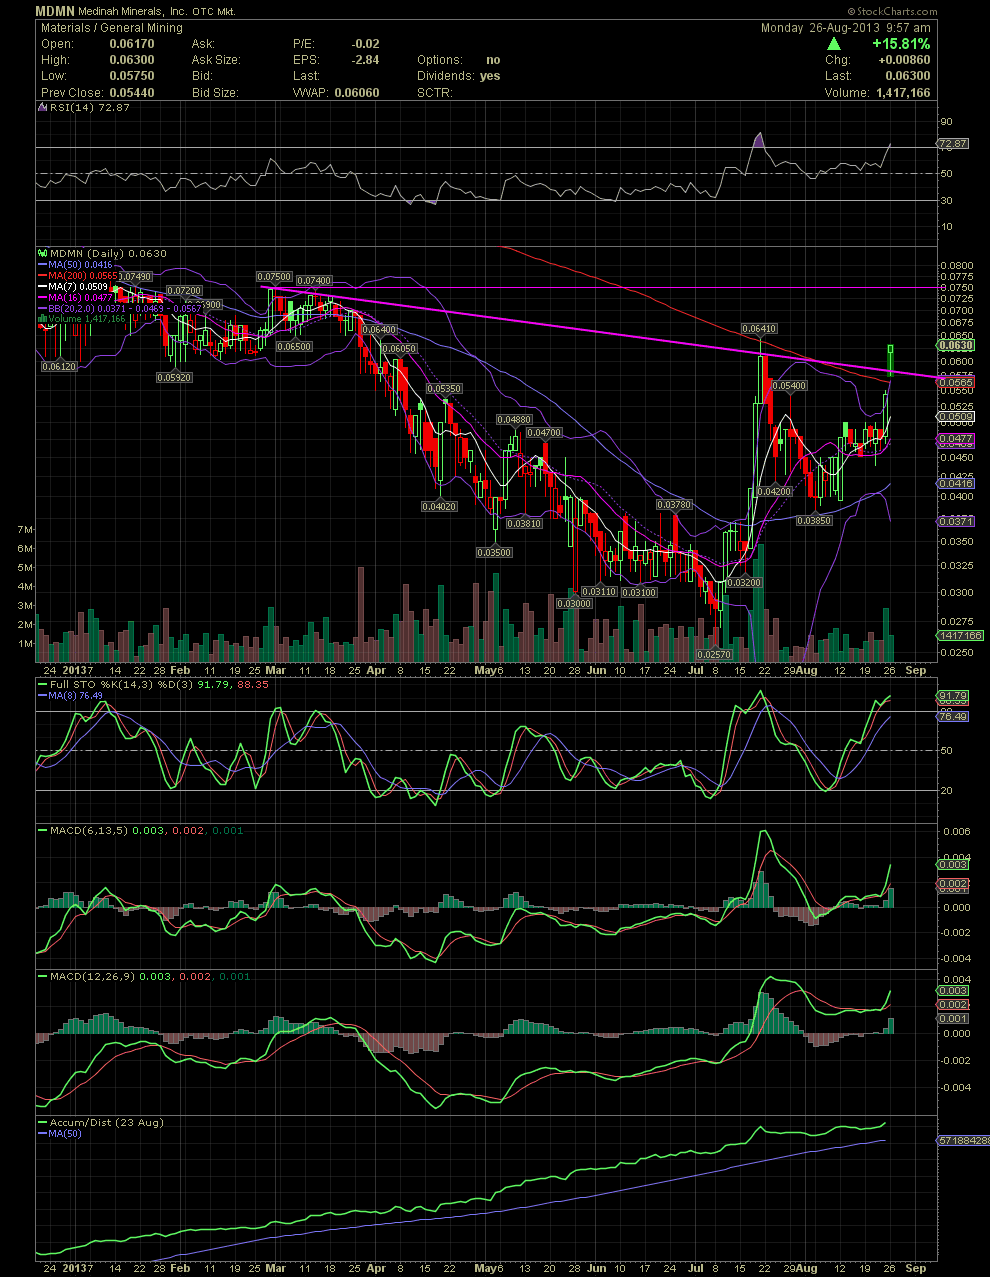
MDMN Daily Chart ~ Moving Up in Anticipation of an
Post# of 2561

As everyone here knows, I am no fan of an amateur hour gap to the upside, especially one that takes a stock way outside the upper bollie. Most end up failing but one never knows what might happen in Medinahland. That said, MDMN gave a buy signal in early July and moved up sharply shortly thereafter to slam into the MA200. After retracing to the MA50, MDMN settled and began rising again for another attempt at the MA200 which it surpassed this morning. Although one can see the gap on the charts, what's encouraging is that most indicators are not yet in overbought territory. The horizontal resistance of the July top is .064. The stock just hit .0639. So the question now is, is this move an exhaustion gap or will MDMN finally get back into higher levels not seen for months. Should the stock close above .064, then I see the next resistance points at .075, then .095 and .13. Should the stock continue higher, I'll begin posting some longer term charts to reflect the longer term resistance points. GLTA

 (0)
(0) (0)
(0)