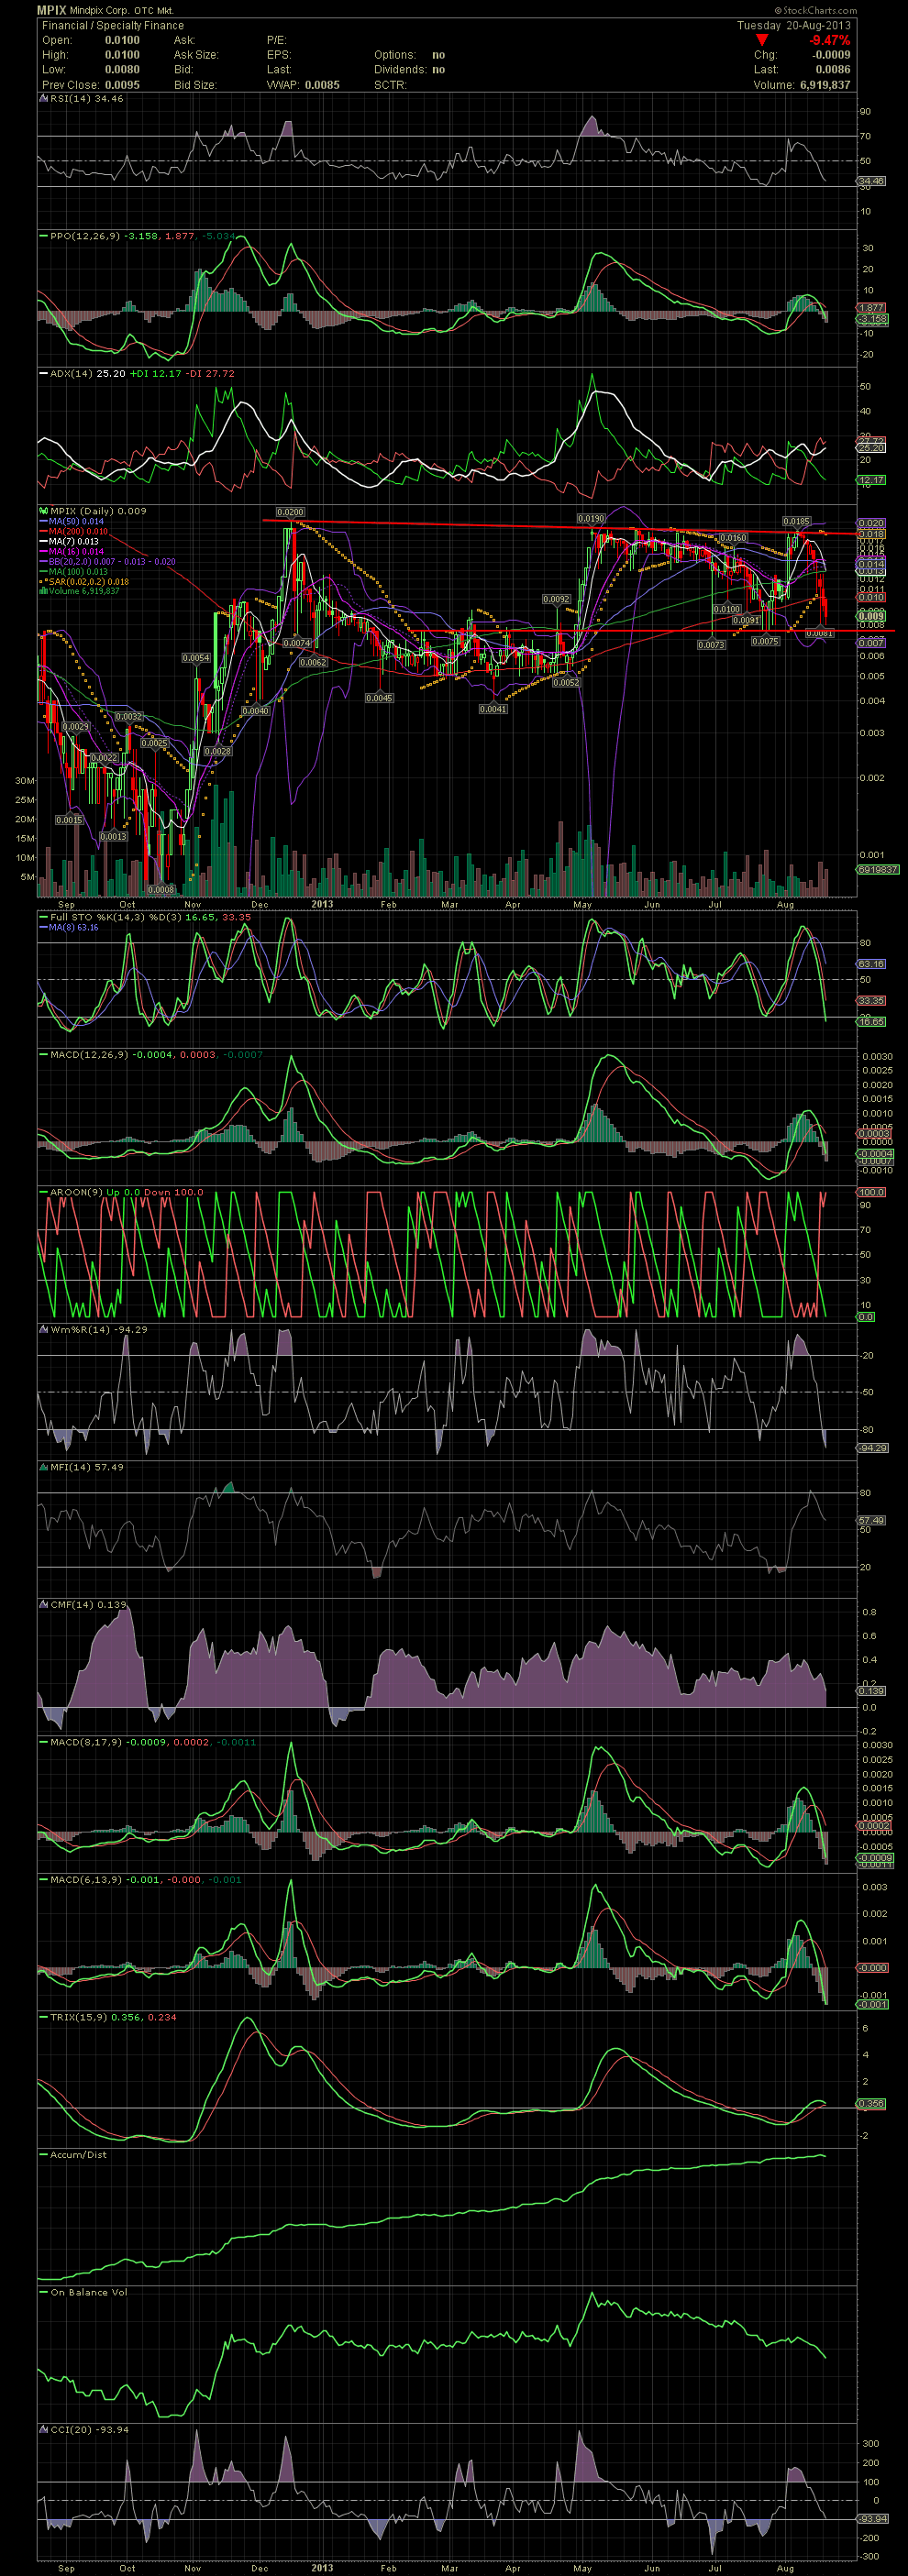
MPIX Daily Chart ~ A Bloody Mess, But That's When
Post# of 5570

I don't like posting ugly ass charts, but you have to take the good with the bad. Although the chart and share price more than stinks, everything with MPIX, the company and management, is better than ever. The technicals and charts aren't quite as oversold yet, as they were just over two weeks ago, but they are getting close. If you take a look at the chart, you'll see what I mean by checking the various indicators currently and the levels/positions, and comparing them to those of late July, the RSI, FullSto, MACDs, Willy, etc. The share price is now just above the .0075 levels which acted as resistance and support at many times since late January. Rather than spend a lot of time writing about the indicators, simple scroll down the right side of the chart and check it out for yourself. So the question is, does one add or enter here just above the long horizontal support line (red) or what for the chart and indicators to reset and show a possible reversal. I suppose that would depend upon one's one strategy and timeframes. But in my opinion, the stock was at these levels and found support many times in the past and could very well see this .008ish level hold again. If you believe that Victor, Saul, and T.E.A.M. are doing things correctly, then you the current levels are stupid cheap. MPIX can really move quickly when the seller(s) moves aside, for even just an hour as everyone saw two Friday's ago. GLTA

 (0)
(0) (0)
(0)