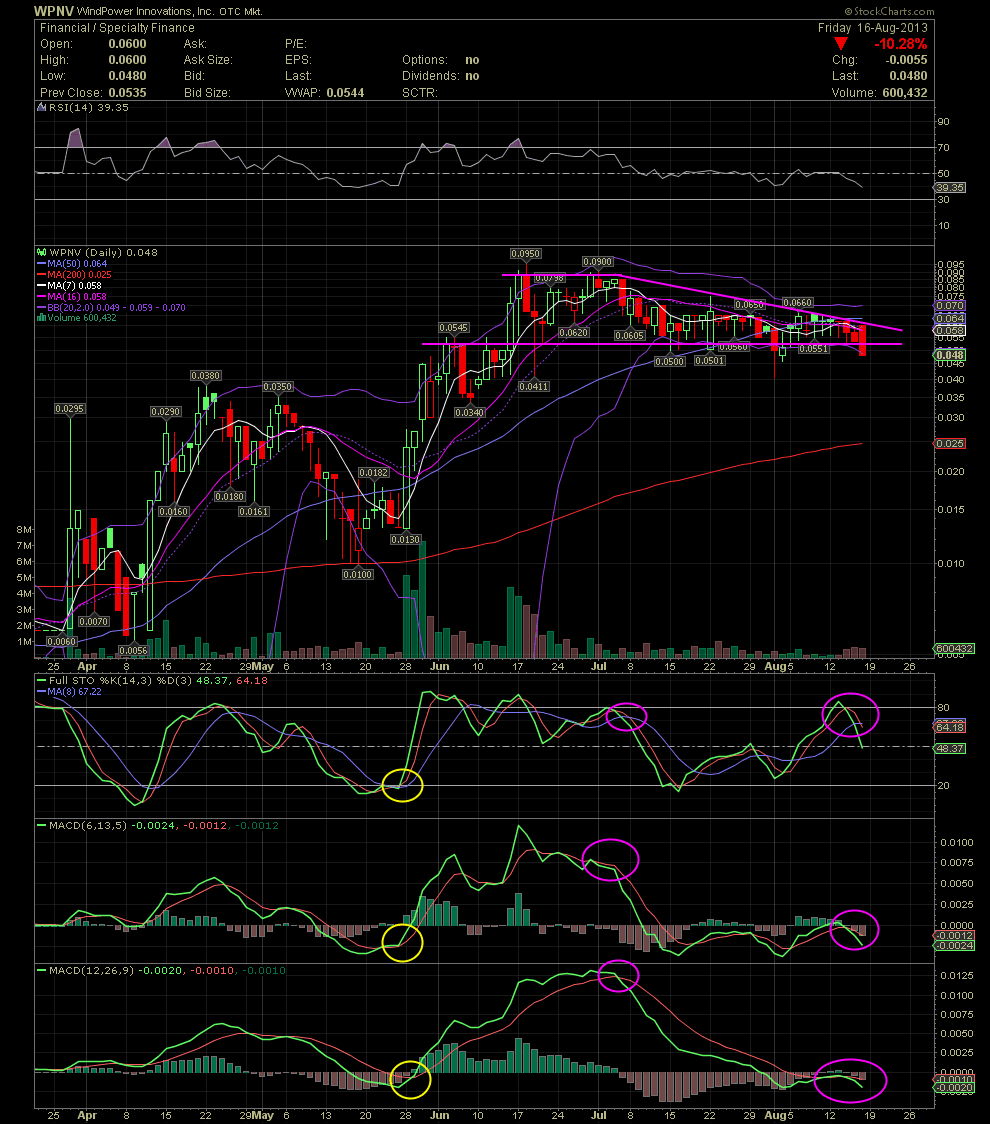
WPNV Daily Chart ~ A Renewed Sell Signal Isn't Bod
Post# of 2561

While many of us did very well with WPNV, the chart has been in a sell signal for weeks even though WPNV has been holding a horizontal support line of approx .054. Note the direction of the RSI since mid June. One of my more important indicators is the MACD with the settings of 12,26,9. There has been no crossover to the upside since early July when the stock was still near .09. A cross to the upside almost occurred last week, but Thursday and Friday began to slip to the downside as the signal and indicator lines are showing divergence and separation. This is the exact opposite of a bullish setup as you can see in late May. During the trading since the highs of June, note the declining tops line that kept a lid on all rally attempts. Of importance now would be to watch for any increase in selling volume since the stock closed below the horizontal support which held for months. This could simply be a headfake or the beginnings of a selloff. I couldn't tell you. But the chart has looked weak for a while now. We'll keep an eye on WPNV, and if this level doesn't hold, I'd be looking at .041 and then .034 as possible support areas. But as long as the indicators are in decline, I would be cautious. Any strong material news would obviously reverse the current trend. GLTA

 (0)
(0) (0)
(0)