SNTL Daily Chart ~ Beginnings of a Breakout The
Post# of 2561

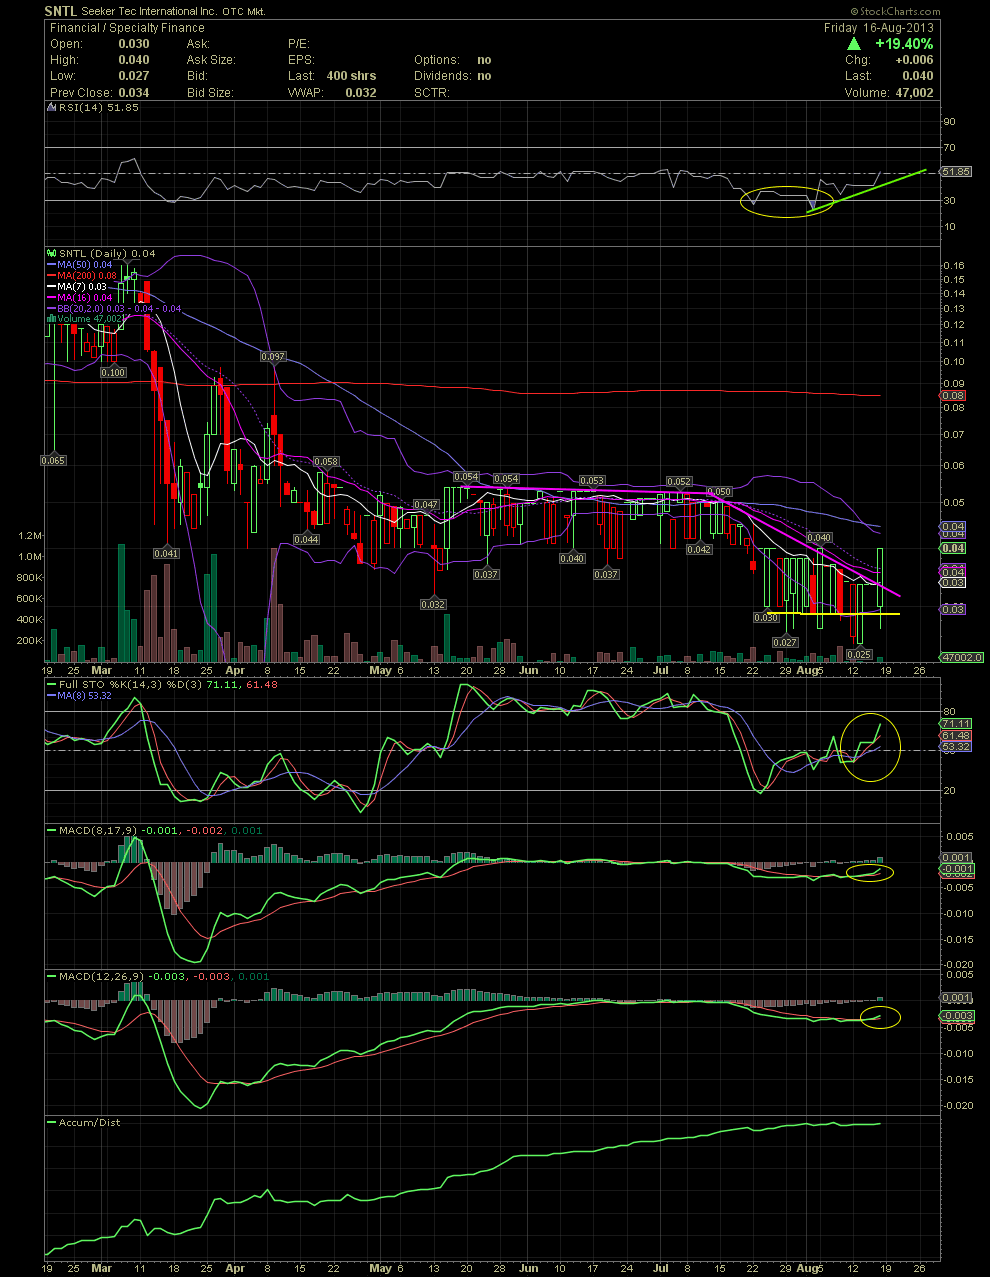
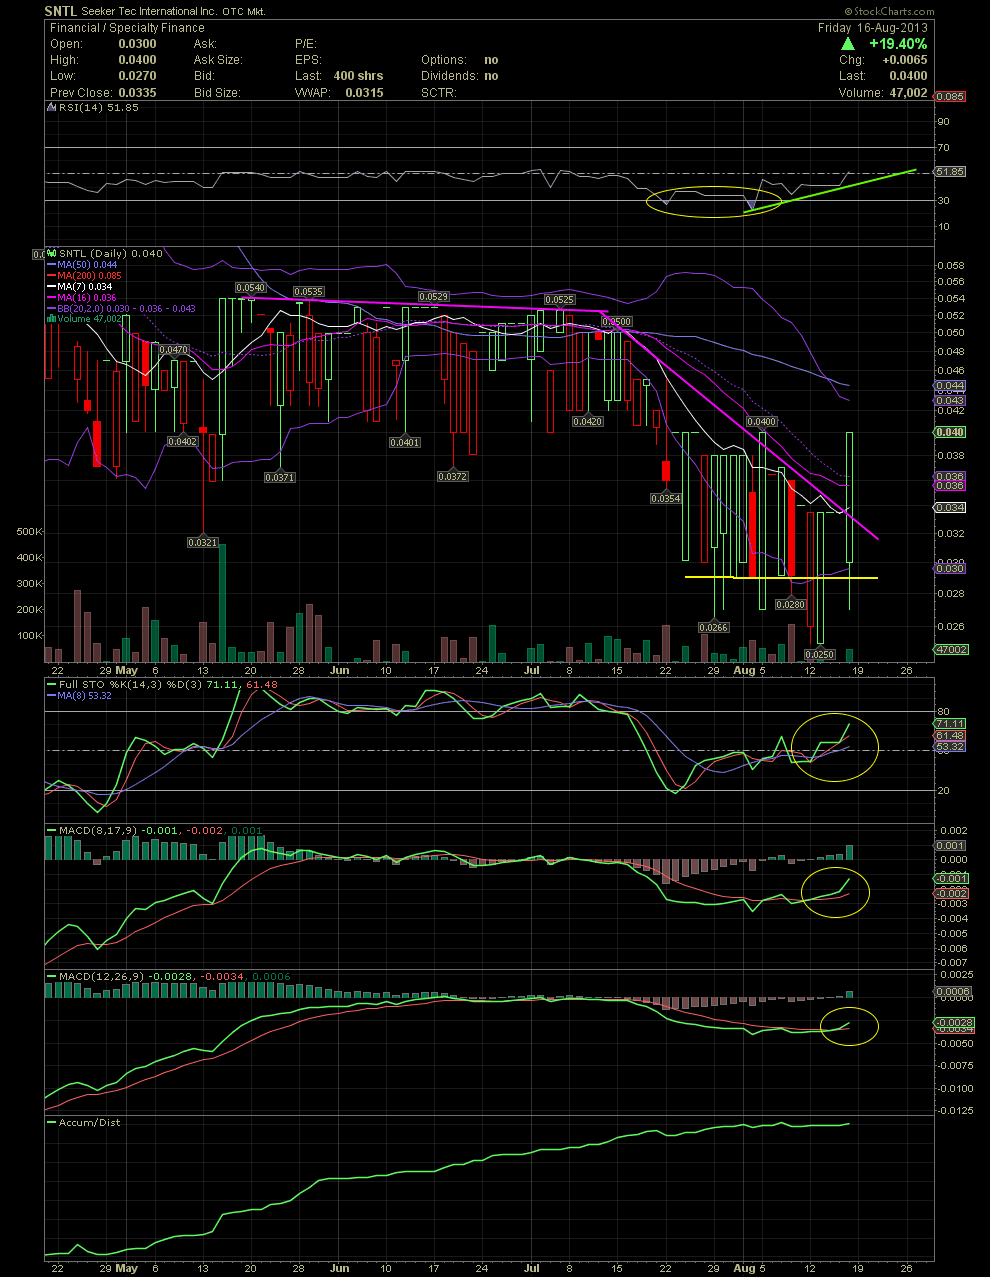
The last couple of weeks, I mentioned that SNTL appears to finally have found its bottom in the .02s and low .03s. The two charts below are the six and four months daily charts. The stock is beginning to respond although on very low volume so far. The first real resistance would be the .05-.054 level which saw most of April thru July as a ceiling. A move over the MA50 and a close of .055 or higher, with some volume, would confirm that a move to the upside and would bring into play a test of the MA200 at .08. The divergence of the RSI and FullSto over the last few weeks as SNTL traded flat during that time, was showing that a move to the upside was near. This boring play could and should see a move to at least .08 over the next few weeks. GLTA

A closer view of the divergence of the RSI and FullSto while SNTL was channeling just prior to the move to .04 from .025.

 (0)
(0) (0)
(0)