Here's a MPIX Weekly Chart from a friend of mine,
Post# of 5570
Posted On: 08/05/2013 8:56:26 AM

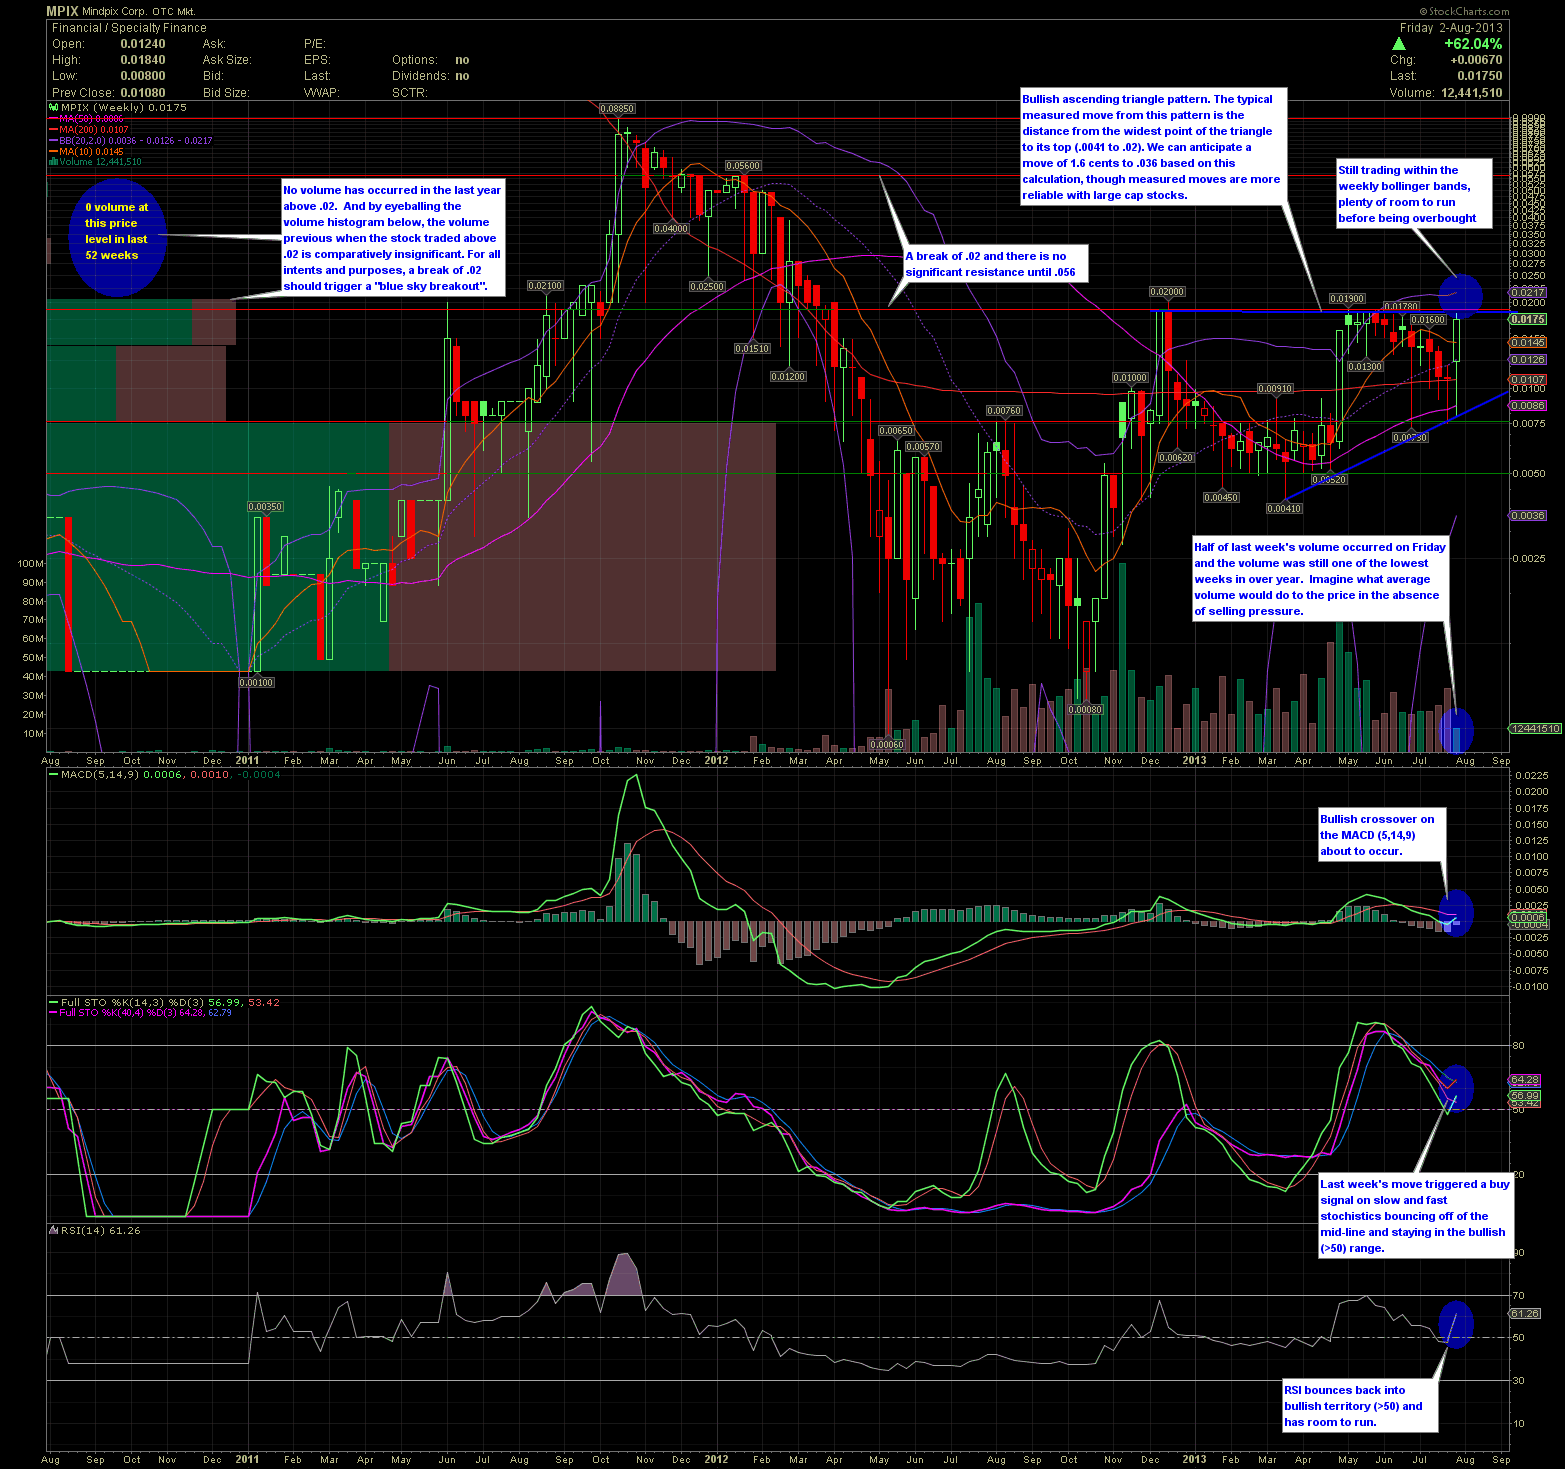
Here's a MPIX Weekly Chart from a friend of mine, Hurricane_Rick, that I wanted to share with everyone over here. As always, great technical work. Thanks Rick!
___________________________________________
MPIX Weekly Chart Annotations
Friday's EOD 62% rally has obviously put MPIX on a lot of people's radar and with good reason. By looking at the weekly chart we get a good picture of where a follow through breakout rally could move to, and with little resistance. Consider the following:
.02 Resistance
.02 is the obvious near term resistance. A break of the .02 resistance level and there is no significant resistance until .056.
Ascending Triangle
The .02 resistance line also coincides with an ascending triangle pattern. Personally I love when a significant resistance line coincides with this pattern. The typical measured move from an ascending triangle pattern is the distance from the widest point of the triangle to its top (.0041 to .02). As such, we might anticipate a move of 1.6 cents to .036 based on this calculation, though be mindful that measured moves are less reliable with penny stocks.
Volume Notes
In the last 52 weeks, no shares have traded above .02. And by eyeballing the volume histogram on the chart, the volume previous to that when the stock traded above .02 is comparatively insignificant. For all intents and purposes, a break of .02 should trigger what would be equivalent to a "blue sky breakout".
In addition, half of last week's volume occurred on Friday and the volume was still one of the lowest weeks in over year. Imagine what average volume would do to the price in the absence of any significant selling pressure.
Bollinger Bands
While the daily chart is now trading outside of the Bollinger Bands, the stock still has room within the weekly Bollinger Bands so there is still room to run before being overbought. This may result in some profit-taking on a daily basis, but result in an overall upward continuation on the weekly chart.
Momentum Indicators
Last week's move triggered a buy signal on slow and fast stochistics bouncing off of the mid-line and staying in the bullish (>50) range.
There is a bullish crossover on the MACD (5,14,9) about to occur...probably this week if Friday's rally follows through.
RSI bounced back into bullish territory (>50) and has room to run.
Conclusion
A 62% move in the last hour or so of trading on a Friday is definitely a cat-out-of-the-bag tell for any stock, penny or otherwise. It is unlikely that the rally was caused by some unwitting investor putting in a market buy order. It certainly "feels" like a breakout above .02 is about to occur and the chart supports this notion. It will be interesting to see how much resistance is placed at the .02 level and I'm guessing we should know fairly quickly this morning whether Friday's rally was for real or not.
 (0)
(0) (0)
(0)