AGDY Daily Chart ~ A Sharp Decline After Hitting a
Post# of 2561
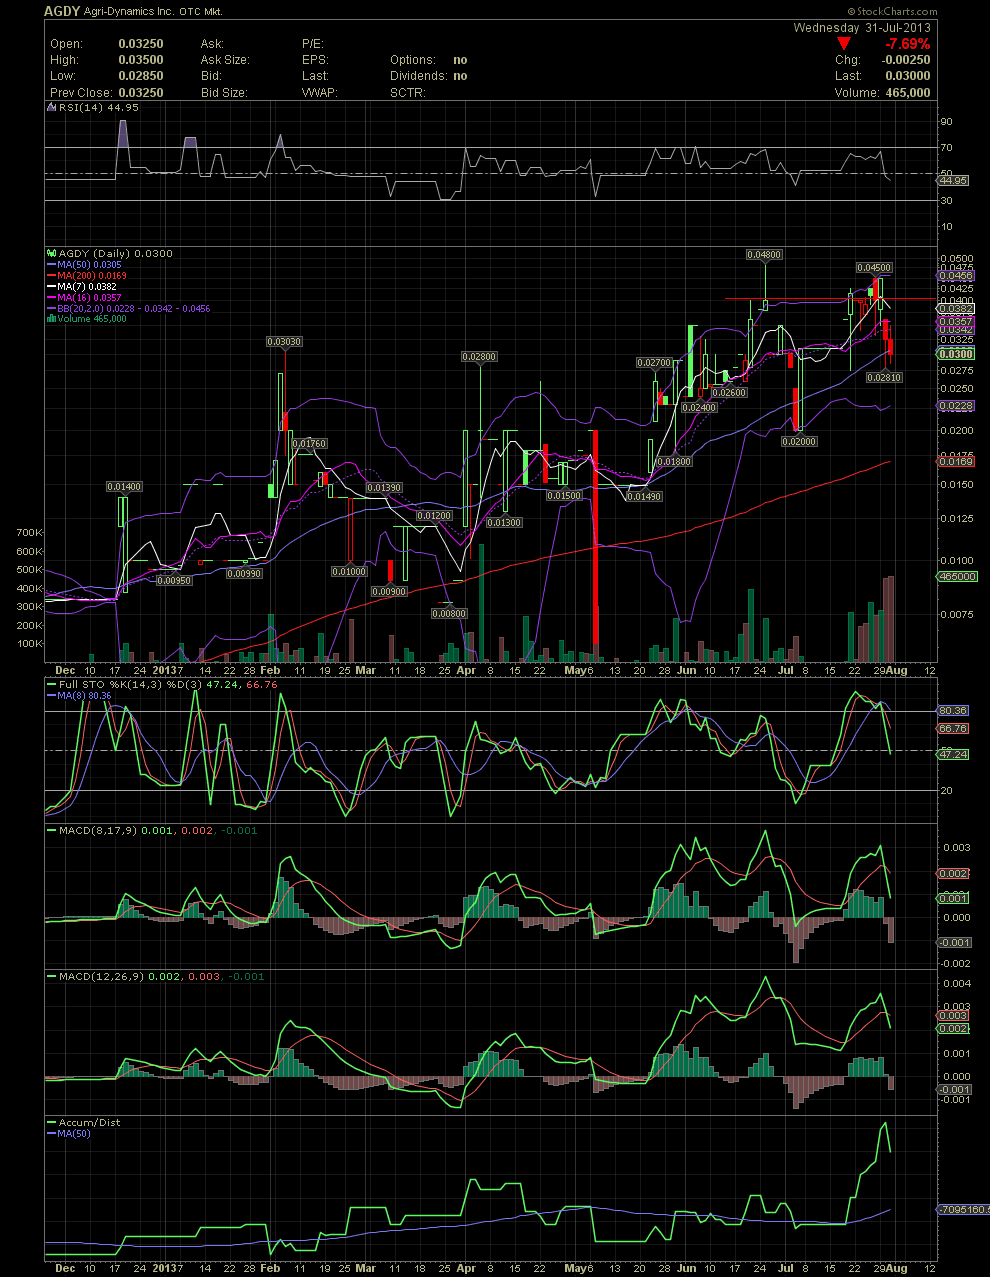
AGDY Daily Chart ~ A Sharp Decline After Hitting a New Multi Year High
Here's a follow up on my previous AGDY chart. The sharp drop from .045 to .03 is being attributed to a seller of approx 800k shares that has been coming through market maker BMAK. For those invested or following along, it's unfortunate that this individual has no concept of how to sell stock into a rising share price. But fortunately for those still accumulating as I am, use this pullback to buy a few more. Something is cooking here as we've already seen with the company transitioning from a Skull and Crossbones to Fully Reporting. I'm not looking at AGDY as a fundamental play but rather as a potential player in the oil industry as per recent releases from the company. I still use the chart for potential entry points, and the current level is sitting on the MA50. The rest of the indicators, plainly stated, suck. When a company only has 7 mil in the float, it will be a very volatile when it comes to the share price. I have no idea if the current seller has anymore stock, but imo it's an opportunity to add while the selling volume allows ones to accumulate some size. Check out the volume bars and one can see the recent increase. The only positive on top of the added volume enabling a few to add a few 100k shares, is that the technicals are no longer near overbought levels. There just aren't many shares available to build a large position. A few friends and I have been accumulating for a few months now, and we added more yesterday on the bids. When the seller(s) is done, we will shift our buying to the ask. I would expect to see AGDY move sharply back to new highs on on any strong material news. GLTA

 (0)
(0) (0)
(0)