MPIX Daily Chart ~ A Three Month Overview I re
Post# of 5570

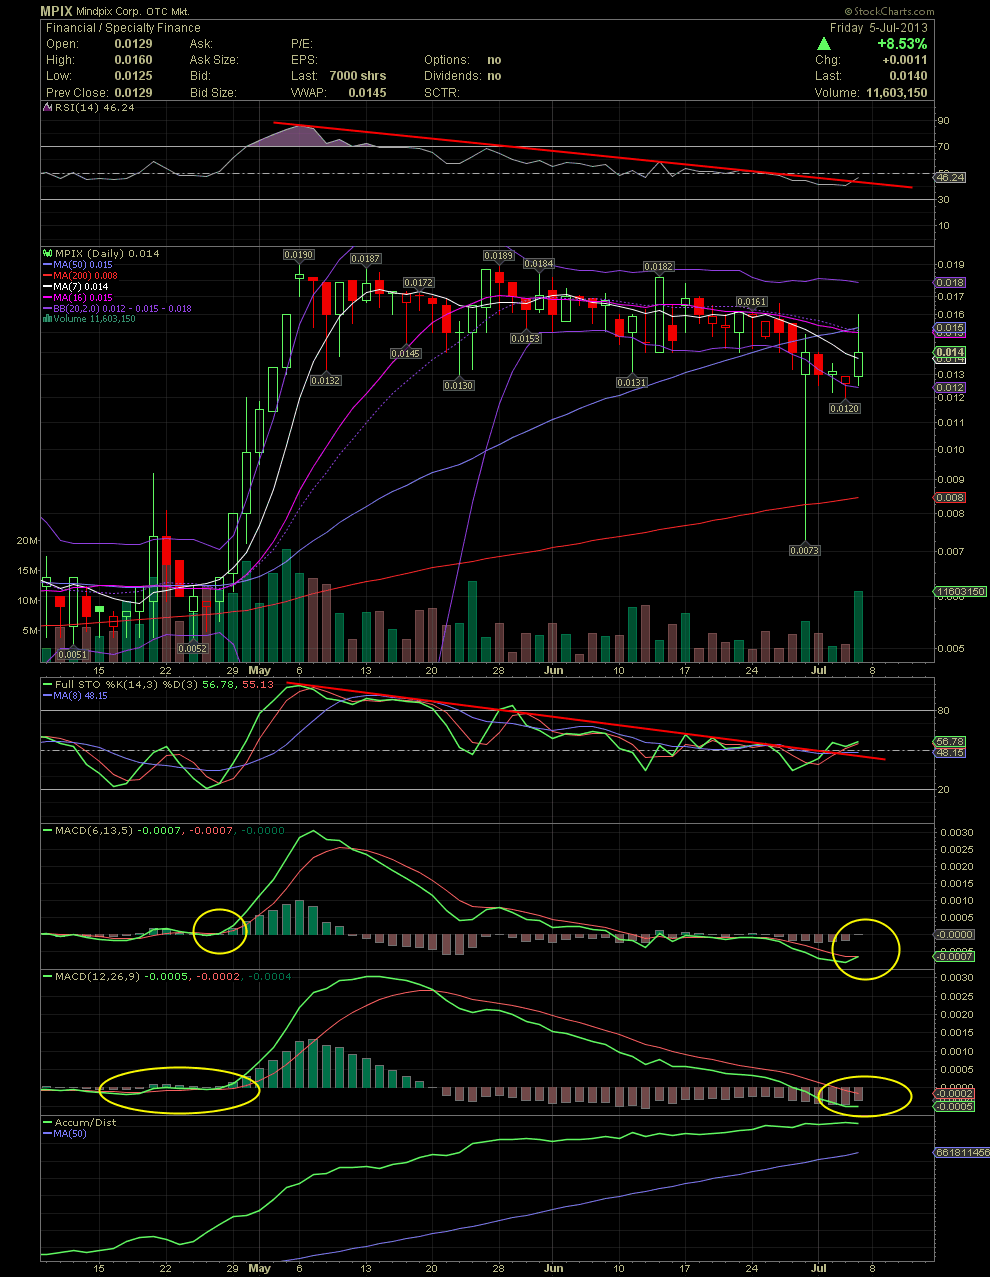
MPIX Daily Chart ~ A Three Month Overview
I received quite a few requests for some charts on MPIX. So here we go before I run out for my grand daughter's birthday party in a bit.
Let's begin with the RSI at the top of the chart. It appears this indicator might finally be ready to break above the declining tops line (red) in effect since May 6. Friday's action just barely broke above that line. Scroll down below the actual chart now to the FullSto. Same direction here with a short term move above the declining tops line (red) and above the FullSto 50 line. Next is the shorter term MACD which is sitting is showing an imminent cross to the upside (circled in yellow). The slower MACD has been in a sell signal since shortly after the May 6 top at .019. Although the green signal line hasn't crossed over the red indicator line yet, it's interesting to note the entire decline from extremely overbought conditions from when the stock ran from .005 to .019. Since then, both MACDs have fallen well below their zero points and are now beginning to level out and curl upwards from what can be clearly seen as oversold levels. I also circled two area for both MACDs in late April that had similar setups just prior to the move from .005 to .019. Scrolling back up to the actual chart, please note the amount of time the stock has traded under the MA16 and MA20 (MA 20 is the same as the middle bollie band, dotted purple). Most attempts to trade thru it and stay above it have failed. Once the stock recaptures the MA20, I believe many technical traders will enter on that move up and over. Finally, the volume stick of Friday was the highest volume since May 23 when the stock hit .0189. My opinion it we are set for a big move up. Once those restated financials are released, and the company is back on honest filings, I believe we'll see that mid .05s fairly quickly. That level can be seen when I post a weekly chart in a few minutes. GLTA
 (0)
(0) (0)
(0)