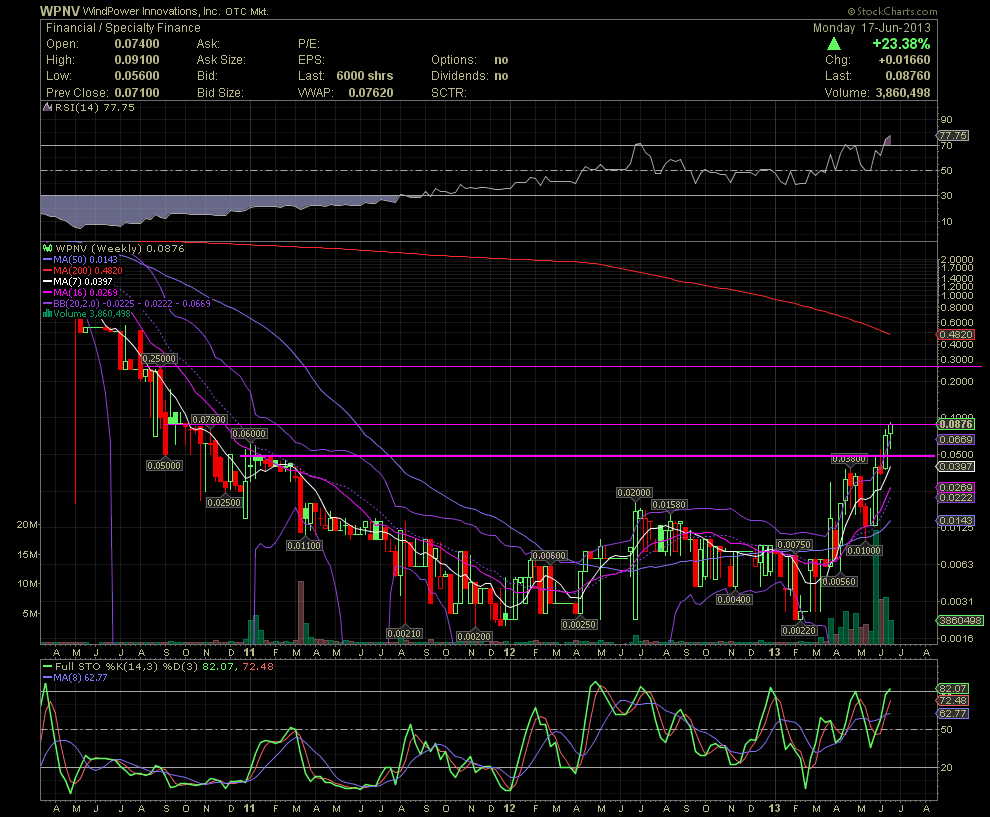
WPNV Weekly Chart ~ The Big Picture As mention
Post# of 89664

WPNV Weekly Chart ~ The Big Picture
As mentioned previously as far back as six weeks, WPNV needed to close over the .055/.06 levels in order to bring into play a possible run to test the .20s. The MA200 is coming down sharply having dropped by .03 since Friday's close. Should WPNV break above the upper horizontal line, we'll see where the MA200 is resting at that time. I added an extra horizontal resistance level in between the two I have been posting, near the mid .08s, but since the stock consolidated there for only a week or two in Jan '11, I wouldn't expect too much trouble getting thru that zone. Continuation tomorrow, with strong buying pressure, should easily move WPNV to or above a close of .10. That dime break just might trigger a cover for a few of the smaller shorts. Any material news would be welcome at any time now. GLTA

 (0)
(0) (0)
(0)