SNTL Daily Chart ~ This One is Setting Up for a Bi
Post# of 2561

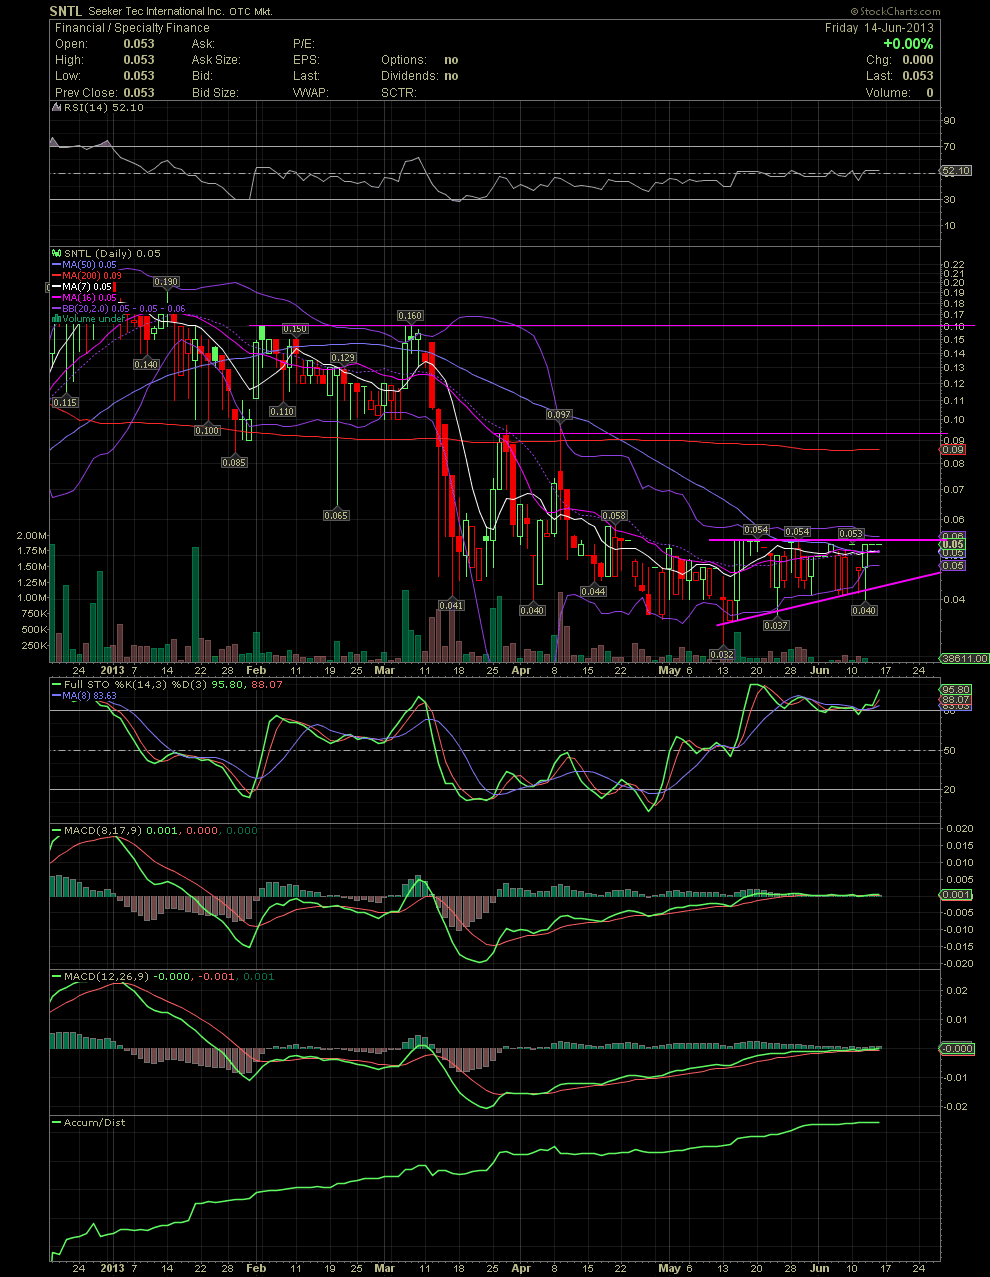
SNTL Daily Chart ~ This One is Setting Up for a Big Move
The SNTL chart below is looking like an easy 100-200% coming over the next few weeks should the horizontal resistance of .054 be taken out with any volume. Someone has kept a lid on the .053/.054 for over four weeks. A few of us have been accumulating from the high .03s/low .04s, but the last few days has offered up very few low .04s. A break and close over .055 would bring into play a test of the next horizontal resistance point of the low .09s. I don't see a lot large amount of resistance there, so I'm actually looking for a test of the .15/.16 level. Imo the stock is getting ready for a run to at least .10-.12. GLTA

 (0)
(0) (0)
(0)