NTEK Daily Chart First of all, my apologies
Post# of 96902

NTEK Daily Chart
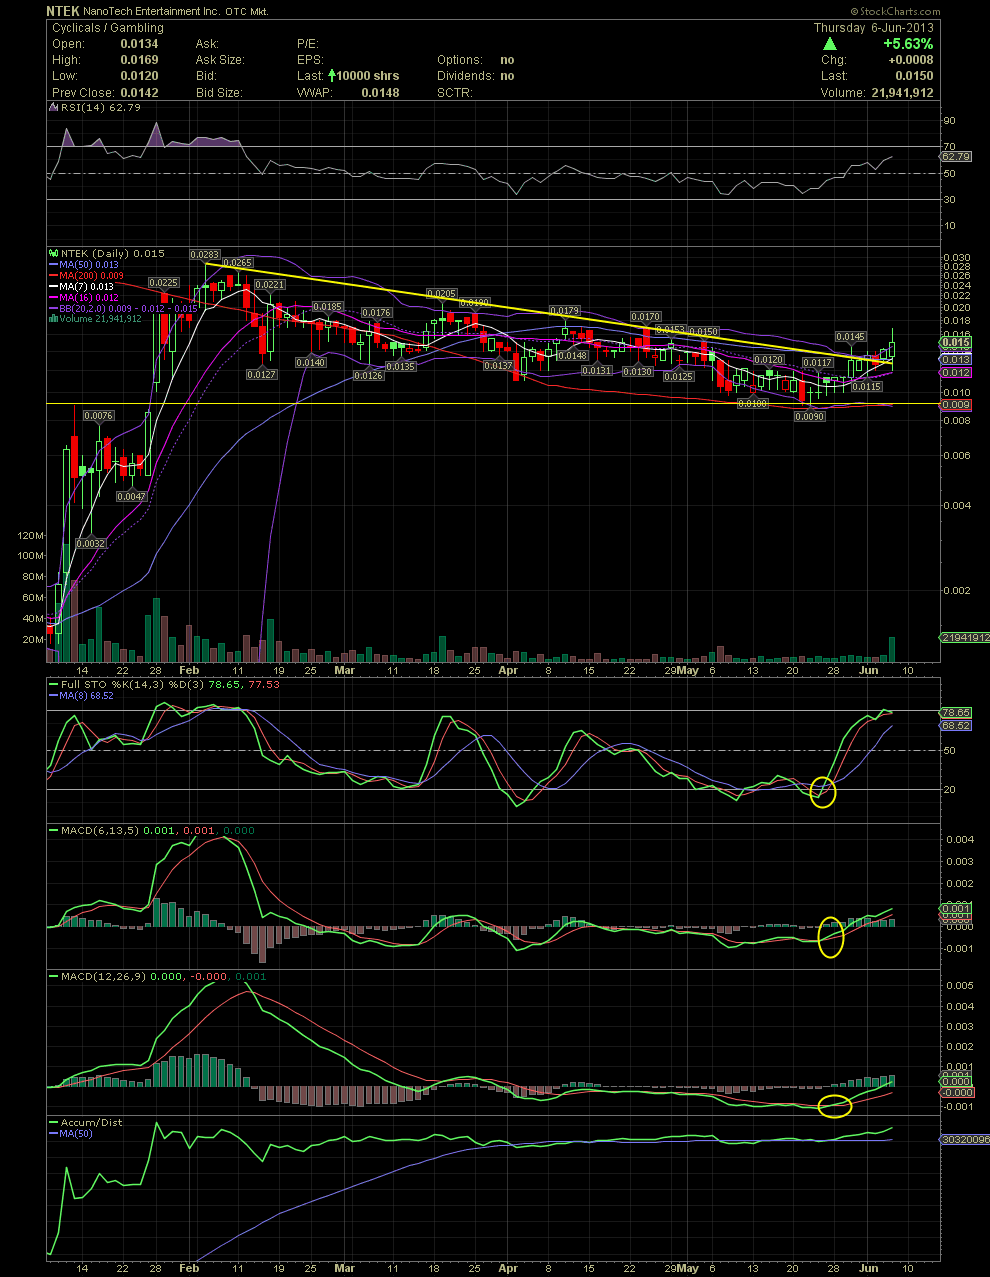
First of all, my apologies to PowerPuncher and all of you! I posted the following message a few days ago, and didn't realize I had the wrong chart attached to my post. Yikes! I've been completely scattered brained since last Thursday evening when my daughter appeared on the Wheel of Fortune and won the $1,030,400. The highest ever in the history of The Wheel. Here's what I posted the other day: As one can see, NTEK has been in a multi month consolidation with a slight downward bias. The high .009s held which I have noted with a yellow horizontal support line from the high just prior to the gap up and run back in January. Since hitting the high of .0283, the stock has encountered many failures to break out of the resistance line noted by the yellow declining tops line. For a brief time today, the stock moved above it. It's not unusual to break thru on the first attempt. To maybe tomorrow or early next week the stock will finally reverse direction and beginning a steady move up. The turn began when the FullSto and MACDs began crossing into a positive position which I circled in yellow. Volume has been increasing slightly the last three days. What would be good to see next is a high volume day and closing above the declining tops line. A close above .0145 would be an initial confirmation. A run to and over .017 would be very bullish. GLTA
And here's an updated chart thru today, and you can see that things are right on track.

 (0)
(0) (0)
(0)