MPIX Daily Chart with Fibonacci I received a f
Post# of 5570

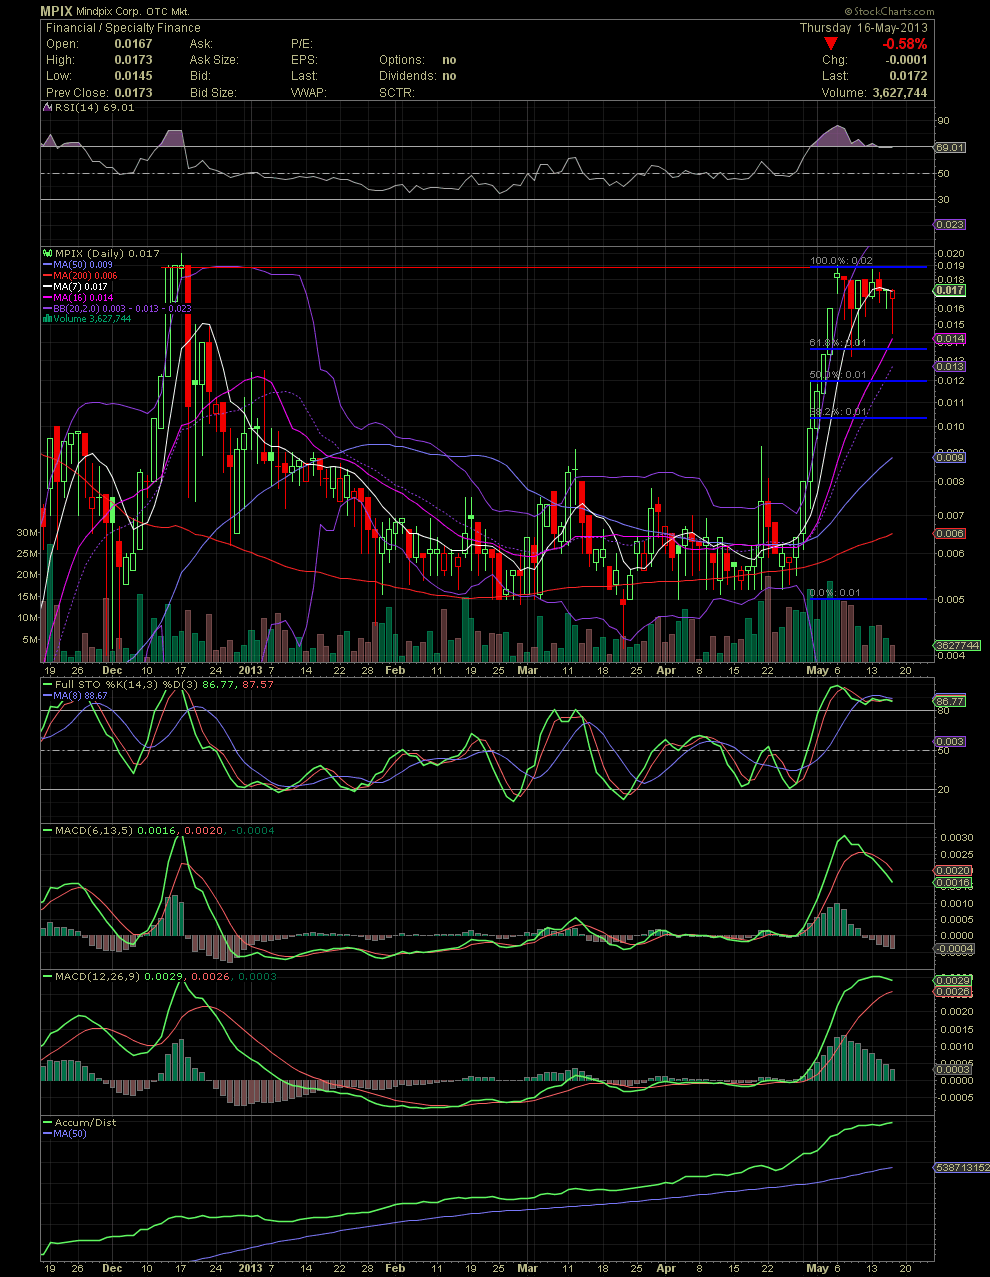
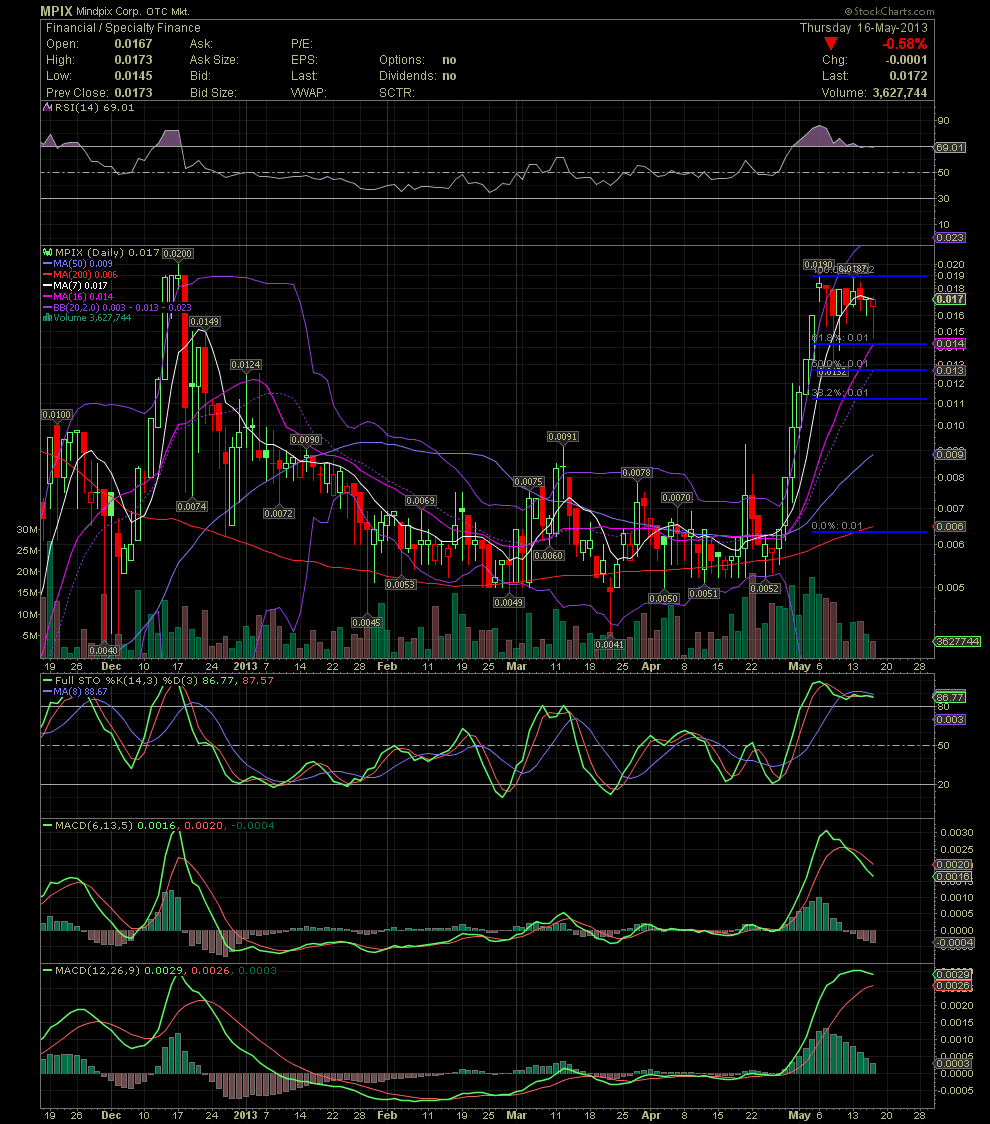
MPIX Daily Chart with Fibonacci
I received a few requests for a reading of a fibonacci indicator. I'll have to say that I'm not well versed in fibonacci. I understand the basics of Fibonacci but I haven't spent the appropriate amount of time necessary to fully educate myself. My basic understanding is limited to how have annotated the following two charts. Depending upon the placement of the beginning of the move, one will get two different levels on the chart. I've spoken to two very good chartist and received to answers with small differences in their explanations of the starting points. So, what I did was offering each chart with two separate trigger points, the first at .005 (the low of the move) and the second at .006 (representing the top of the reset prior to the breakout to .019). Again, these two triggers are based upon two individuals who claim to really understand this indicator. Either way, one results in a 50% retracement at .012 while the second is at .013. The intraday low since the .019 has been .0132. With the strong intraday reversals that we've seen during this correction, I'm going to say that Fibonacci at this point is just another tool. Most everyone I know isn't waiting for a possible dip much lower than we've already seen. One needs to ask what the difference is with a buy of .012 or less versus a buy in the .013s or .014s should the stock run to .25 and higher over the next six months. I sure wouldn't want to be sitting here six months from now after another 2,000% move just to say that I missed buying my position by .001. That would certainly result in an 'OUCH!'
 (0)
(0) (0)
(0)