MPIX Daily Chart ~ Evening GreenFever! Nothing
Post# of 5570

MPIX Daily Chart ~ Evening GreenFever!
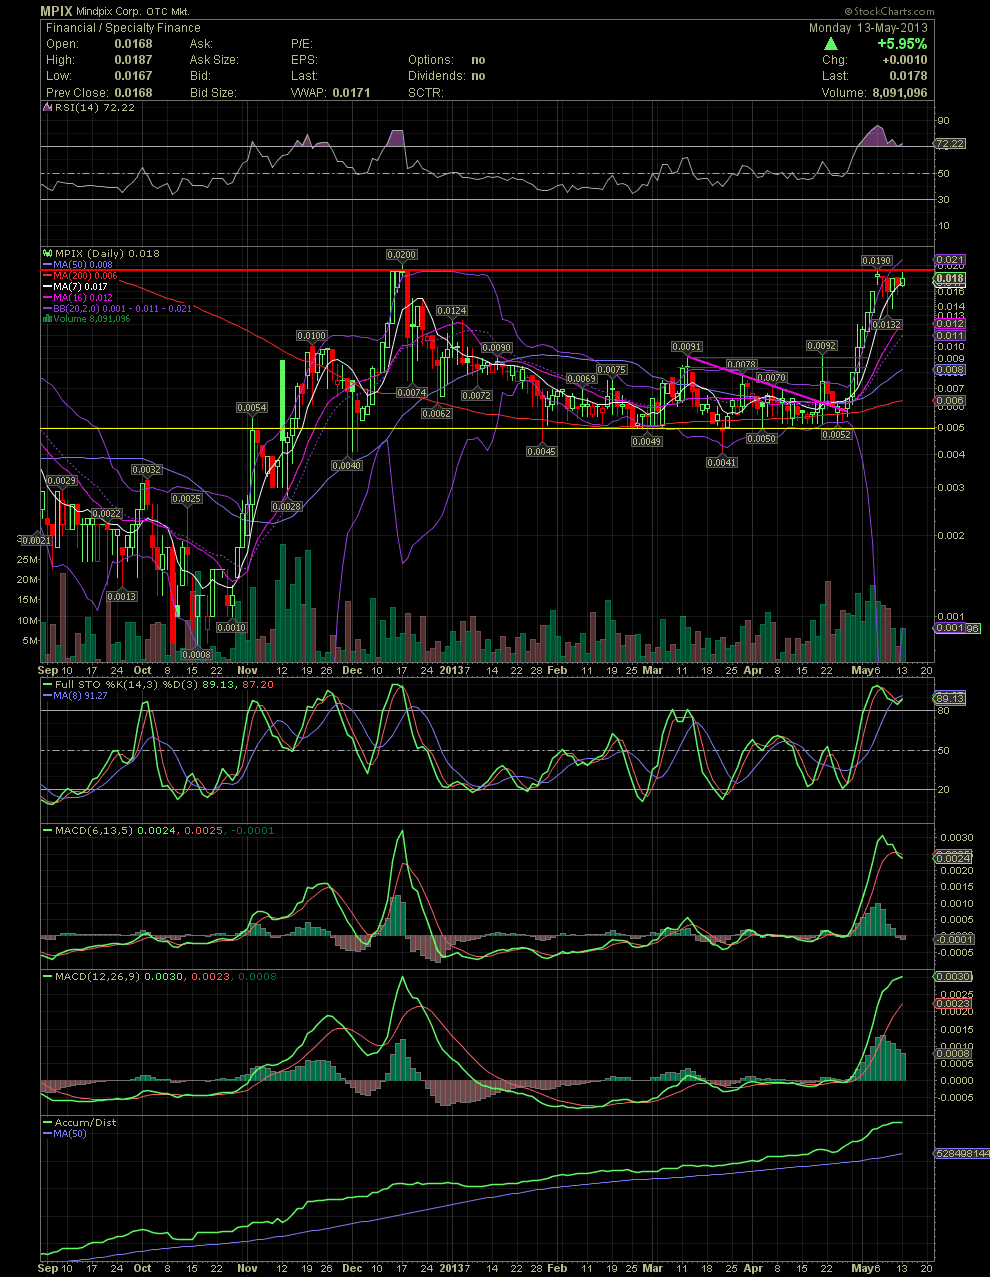
Nothing to be concerned about. My technical mumbo jumbo is all my opinion on what I see on the various charts and indicators that I use. The sharp move up, from the more than obvious multi month base which was established in the .005s, was quick and picture perfect. That is until last Monday when the stock gapped up with the entire candle outside the upper bollie. Those familiar with charting already know that when an entire candle is outside the bollie, it always comes back inside one of three ways. The rate of upward momentum will slow down allowing the bollie to catch up, the stock can collapse and fall back inside the bollies, or it can consolidate and move sideways in a channel. I thought we might see the third option after the first day of trading after the gap. When the stock fell to .0132, and the flippers and nervous sold out while they were expecting a collapse to the .00s, the bulls stepped in aggressively accumulating those shares. Since last Tuesday, MPIX has seen daily higher lows through today. Although most indicators are still in the overbought areas, they have corrected from extremely overbought which typically occurs after an almost 300% move in one week. One look at this chart, and even Stevie Wonder can see why I'm excited about MPIX! GLTA

 (0)
(0) (0)
(0)