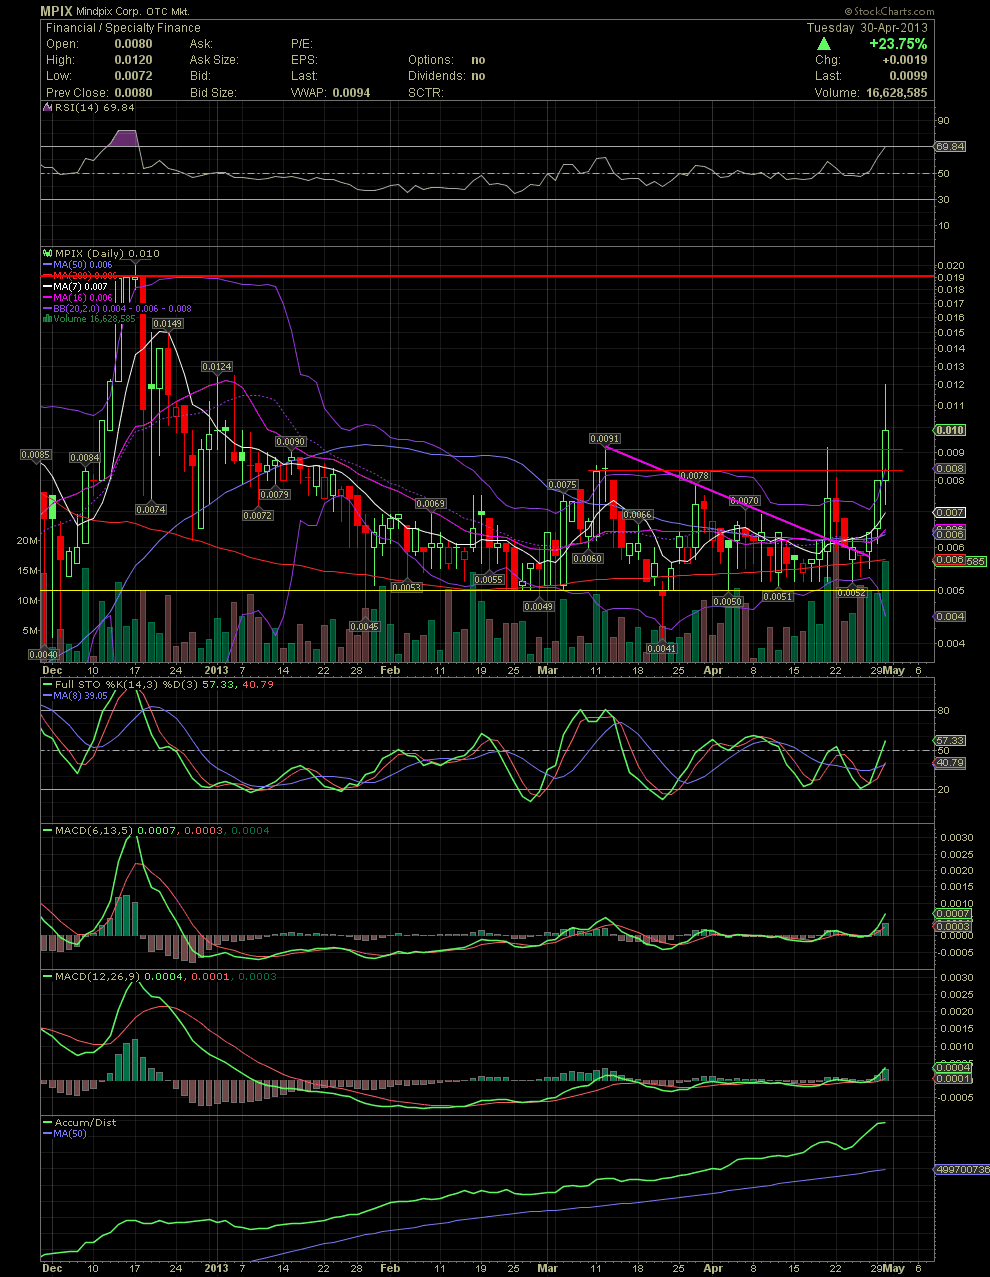
MPIX Daily Chart.......... I was asked last n
Post# of 5570

MPIX Daily Chart..........
I was asked last night by three shareholders what makes this week's move different than the failed breakouts of March and April. There really isn't anything specific, but with March, please note the position of the FullSto as compared to the crossover of the last three days. The current move began from oversold levels near the 20 line rather than from an overbought position above the 80 line. The failure in April can be seen when the stock slammed into a flat upper bollie and a few short term sellers using the .0091 previous high as a reason to sell thus creating the double top that I've referenced the last few days. Yesterday's close above .0092 on rising volume, along with separating FullSto and MACDs, should prove to provide continued movement to the upside. The Moving Averages are also lined up nicely all rising in the appropriate sequence, the MA7 over the 10, 16, 20, 50 and 200. And of great importance to the long term investor is the many months that the share price held onto the MA200. I would hope now that the stock will rise to the Dec top of .02 by the end of next week. Any major news event, such as the reduction of the OS (previously announced to be near 400 mil shares) and the conversion into a non-convertible preferred or material news of a project, would probably be the catalyst to send the MPIX stock over the .02. Should the News Releases/Shareholder Updates continue over the next few weeks/months, my opinion is that the old high of .0885 will be taken out by August. I don't like projections based on timelines, but one can't argue with the recent developments and the longer term view of the chart. GLTA

 (0)
(0) (0)
(0)