.JPG)
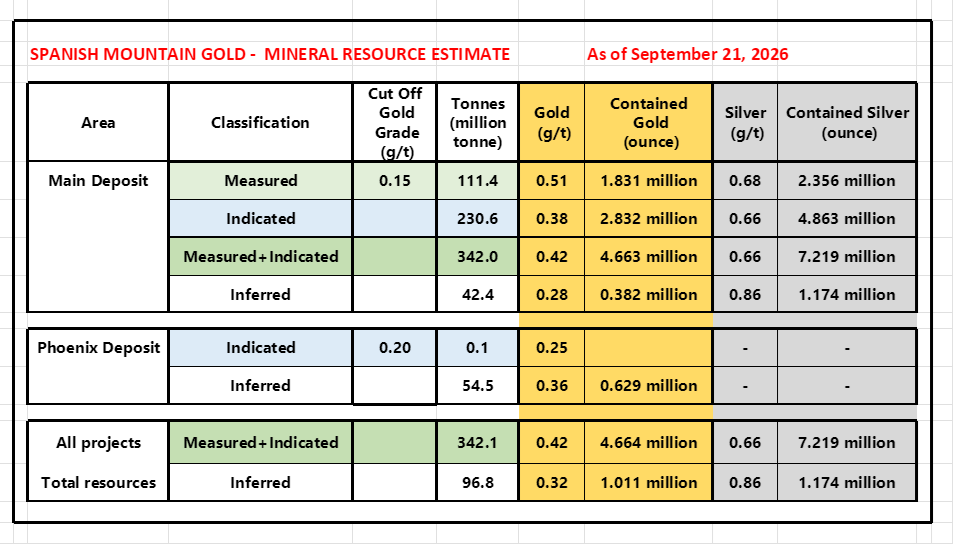
4) Spanish Mountain Gold - Mineral Resource Estimate ( MRE )
Mineral Resource Estimate ( MRE ) as of September 21, 2026
https://investorshangout.com/images/MYImages/...212026.png
The mineral resource in the K-zone is not included in the MRE, all assays generated from this year's K-zone and Orca corridor are preserved to calculate final gold resources for the Feasibility Study. The Feasibility Study will introduce the project's maiden Proven & Probable Mineral Reserves to be incorporated in the Technical Report, they are the highest-confidence category in mining, proving that the ounces are legally, technically, and economically mineable.
.
===========================================
Conjectured gold resources estimate in the K-zone
===========================================
As of July 27, 2026 news release on K-zone drill assays

Drilling area:

K-zone drilling area is about 500 meter x 500 meter x 400 meter deep, so the volume of ores in the drilling area is about 100 million cubic meter.
Density of ore ranges from 2.2 to 4 tonnes per cubic meter depending on gold grade. So the tonnage in K-zone is at least 220 million tonnes. (100 x 10^6 cubic meters x 2.2 tonnes / cubic meters).
Average gold grade in the K-zone is 0.42 g/t and 220 million tonnes of 0.42 g/t contains 3.0 million ounces of gold.
Based on the silver to gold resource ratio of 1.56 in the current MRE (7.219 million ounces silver, 4.663 million ounces gold), with the high grade mineral resource in the K-zone added to the current MRE, the company's gold and silver Reserves in the anticipate Technical Report will likely be 8 million ounces gold and 12 million ounces silver. The company's wealth will make current share price and market capitalization evaluation ridiculous and ludicrous.
.
==============================
Spanish Mountain Gold and its peers
==============================
https://investorshangout.com/images/MYImages/...speers.jpg
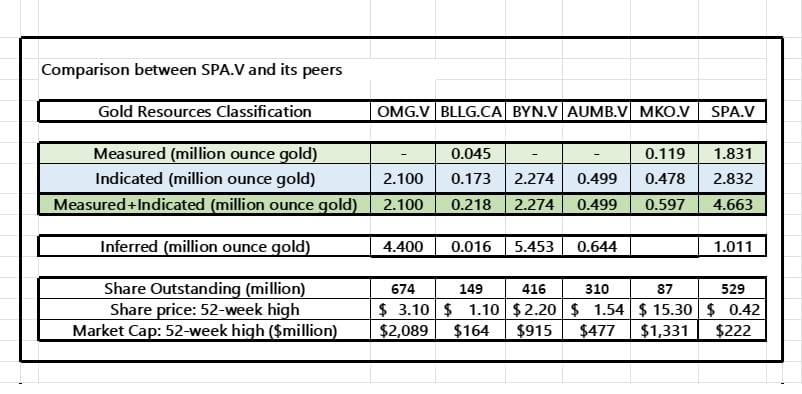
Comparison of gold resources and market capitalization between Spanish Mountain Gold and its peers reveals that SMG's market valuation is tremendously undervalued. But bullish chart technicality forecasts that SMG will catch up with them soon, perhaps even emulate them because SMG has the highest Measured + Indicated resources among its peers. It will be even more undervalued when the Feasibility Study confirms the Proven and Probable gold reserves to be 8 million ounces.

In 2027 SPA's market capitalization could emulate that of OMG and MKO
Spanish Mountain Gold - In the prolific Cariboo region of British Columbia (SPA.V, SPAUF.OTCQB)
https://www.google.ca/maps/search/Cedar+Creek...FQAw%3D%3D
Mineral Resource Estimate: Page 12 of NI-43-101 Technical Report
https://spanishmountaingold.com/site/assets/f...-final.pdf
SPA.V weekly
https://stockcharts.com/sc3/ui/?s=SPA.V&p...2963243620
Key factors for share price decline:
Main factors: The decline is mainly technical as lack of support and failure in breaking through the 42 cents resistance caused frustration and fatigue among short term investors seeking quick profit, prompting sell off. Share price was also aggravated by news released by Xatśūll First Nation on October 1 announcing the termination of the 2021 and 2012 agreements with Spanish Mountain Gold citing the agreement was never finalized and that the project design has changed over the years. The Xatśūll news triggered panic selling from unsophisticated investors resulting in trading halt. Such news was already published in the 2026 Q2 Management Discussion & Analysis dated August 31. New agreements with the 3 First Nations are being drafted by the company.
Macroeconomic Drag: Mid-October 2026 brought a broader market sell-off driven by hotter-than-expected inflation metrics and looming expectations of a central bank interest rate hike. High-risk, pre-revenue junior resource explorers are usually the first to see capital flight when interest rate fears pick up.
Pre-Revenue Realities: Despite positive feasibility drilling results (e.g., 295 meters of 0.54 g/t gold), a final construction decision isn't slated until 2028. Investors looking for immediate stability opted to pull profits following the First Nations roadblock.
.
~~~~~~~~~~~~~~~~~~~~~~~~~~~~~~~~~~~~~~~~~~~~~~~~~~~~~~~~~~~~~~~~~
Blue Lagoon Resources - Dome Mountain Mine project, British Columbia (BLLG.CA)
https://www.google.ca/maps/place/Dome+Mountai...FQAw%3D%3D
Mineral Resource Estimate: https://bluelagoonresources.com/wp-content/up...slides.pdf
BLLG.CA weekly
https://stockcharts.com/h-sc/ui?s=BLLG.CA&...7291241482
Key factors for share price decline:
Heavy equity dilution: Recent multi-million dollar private placements priced significantly below the $1.10 peak. While the company successfully achieved commercial gold production at its Dome Mountain mine in May 2026, its financing structure created heavy downward pressure on the stock.
Dilutive Capital Raises at Lower Prices: In August 2026, strategic partners Ocean Partners and Nicola Mining injected a combined C$10 million into the company. However, these common shares were issued at C$0.60 per share. This heavily anchored the market price near that level, making a $1.10 valuation unsustainable.
High-Risk Production Decision: Blue Lagoon chose to move into commercial production without a formal feasibility study demonstrating economic and technical viability. This creates a high level of operational uncertainty and risk of technical failure, keeping institutional investors cautious.
Lagging Financial Clarity: Although the company has received C$16.5 million in provisional payments, these figures are gross numbers. The exact operating economics, mining costs, and actual profitability remain unconfirmed until upcoming quarterly financial reports are released.
.
~~~~~~~~~~~~~~~~~~~~~~~~~~~~~~~~~~~~~~~~~~~~~
1911 Gold - True North gold mine, Manitoba ( AUMB.V, AUMBF.OTCQC )
True North Gold Mine
https://www.google.ca/maps/place/True+North+G...FQAw%3D%3D
Mineral Resource Estimate
https://1911gold.com/news/press-releases/1911...ld-project
AUMB.V weekly
https://stockcharts.com/h-sc/ui?s=AUMB.V&...2963243620
The primary catalyst for this steep downward trend is a regulatory enforcement action by the British Columbia Securities Commission (BCSC), coupled with the acute execution risks and heavy dilution typical of development-stage junior mining companies
Key factors for share price decline:
1. BCSC Review and Mandatory PEA Retractions
The most severe damage to investor confidence occurred following a regulatory review by the British Columbia Securities Commission. In July 2026, the company was forced to issue a formal clarification and retraction regarding its February 2026 Preliminary Economic Assessment (PEA) for the True North Gold Project.
Overstated Certainty: 1911 Gold had to explicitly retract previous statements that over-inflated the certainty of its economic results and project timelines.
No Production Decision: The company had to formally clarify to the market that no official production decision has actually been made. This regulatory setback forced institutional and retail investors to heavily discount the project's near-term viability.
2. High Shareholder Dilution and Funding Demands
As an advanced-stage explorer without operational cash flow, 1911 Gold remains heavily dependent on capital markets to fund its underground drilling, mine dewatering, and equipment delivery at True North.
Capital Influx & Dilution: In June 2026, the company entered into a $20 million bought deal financing agreement. While this secured necessary runway, it severely diluted existing shareholders. Total shareholder dilution for AUMB reached a massive 39% over the cycle, putting permanent downward pressure on the per-share value.
3. Broad Market Fatigue Toward Junior Developers
Despite high spot prices for gold bullion serving as a macro tailwind, a risk-off rotation swept through the venture markets in late Q3 2026. Investors shifted capital away from smaller, high-risk junior development equities with high capital expenditure mandates and toward established, cash-flowing gold producers. This market-wide valuation reassessment, combined with localized profit-taking, accelerated AUMB's slide to its 52-week lows.
.
~~~~~~~~~~~~~~~~~~~~~~~~~~~~~~~~~~~~~~~~~~~~
Banyan Gold - AurMac Project in Yukon (BYN.V)
https://www.google.ca/maps/place/Banyan+Gold+...FQAw%3D%3D
Mineral Resource Estimate: https://banyangold.com/projects/aurmac/
BYN.V weekly
https://stockcharts.com/h-sc/ui?s=BYN.V&p...7291241482
BYN.V share price declined from its all-time high of $2.20 to $1.57, driven primarily by a massive capital raise and share dilution event, alongside typical "sell-the-news" profit-taking following key operational catalysts.
Key factors for share price decline:
Massive Equity Financing & Dilution: The most direct catalyst for the price drop was the announcement and rapid closing of a massive $54.3 million financing package. On September 20—just two days after the stock hit its peak—Banyan announced a $50 million Listed Issuer Financing Exemption (LIFE) offering and an $8 million private placement, both priced at $2.00 per share.
The Impact: When a junior miner issues millions of new shares, it heavily dilutes existing shareholders. Because the financing finally closed on September 29, it created an immediate cap on near-term upward momentum, causing the price to slide toward and eventually slip below the $2.00 offering price as supply overwhelmed demand.
Post-Catalyst Profit-Taking: Leading up to September 18, BYN experienced a powerful run-up fueled by anticipation surrounding its updated 8.6 million-ounce mineral resource update at the flagship AurMac Gold Project and its inclusion in the VanEck Junior Gold Miners ETF (GDXJ). Once these major multi-month milestones were achieved and the subsequent financing was structured, many short-term institutional and retail investors engaged in profit-taking.
Shift in Junior Mining Risk Appetite: Broad macro sentiment toward exploration and development-stage junior gold companies grew more cautious in late September and October. Despite historically high underlying gold prices, investors actively rotated and repositioned out of high-beta junior developers into safer producers as capital needs across the junior exploration sector expanded.
Despite the recent ~28% drop from its peak, Banyan's underlying long-term thesis remains heavily backed, notably highlighted by senior royalty giant Franco-Nevada subscribing for 10 million shares during the recent financing round.
.
~~~~~~~~~~~~~~~~~~~~~~~~~~~~~~~~~~~~~~~~~~~~~
Omai Gold Mines - Guyana (OMG.V)
https://www.google.ca/maps/place/OMAI+GOLD+MI...FQAw%3D%3D
Mineral Resource Estimate: https://omaigoldmines.com/omai-project/overview/
OMG.V weekly
https://stockcharts.com/sc3/ui/?s=OMG.V&p...2963243620
Key factors for share price decline:
"Sell the News" Post-PEA Consolidation: Omai Gold stock experienced a monumental run leading up to the release of its $4.0 Billion after-tax NPV in the Preliminary Economic Assessment in August 2026 and its definitive NI 43-101 technical report on October 5, 2026. Once these heavily anticipated updates became official, many early-stage investors locked in substantial profits.
Macro Sector Volatility: Junior and developer mining equities on the S&P/TSX Venture Composite Index have experienced broader pressure due to short-term pullbacks and volatility in spot gold pricing. Development-stage operations are highly sensitive to these broader market risk appetites.
Transition into Capital & Operational Risk: Now that the initial engineering studies are complete, investors are beginning to price in the longer-term hurdles. Moving from a study to real-world development requires substantial future financing, potential share dilution, and complex permitting timelines.
.
~~~~~~~~~~~~~~~~~~~~~~~~~~~~~~~~~~~~~~~~~~~~~
Mako Mining, Moss Mine, Arizona (MKO.V, MAKO.NASDAQ)
https://www.google.ca/maps/place/Moss+Mine/@3...FQAw%3D%3D
Mineral Resource Estimate
https://makominingcorp.com/news-media/press-r...nt_id=1146
Note: If MKO Mining's current 87 million shares outstanding is diluted 6 times to 529 million shares equaling to that of Spanish Mountain Gold, its 52-week high share price would be at $2.33 with 52-week high market capitalization of $1.33 billion.
MKO.V weekly
https://stockcharts.com/sc3/ui/?s=MKO.V&p...2963243620
Decline in Mako Mining share price is primarily driven by recent insider selling, broader sector volatility, and capital consolidation after massive multi-year gains. Despite strong underlying fundamentals, several distinct triggers shifted short-term investor sentiment.
Key Drivers of share price decline:
Major Insider Selling: Investor scrutiny increased following disclosures that Chief Operating Officer Jesse Munoz sold approximately CA$283,000 worth of stock (representing 30% of his total holdings) at an average price of CA$14.17. Over the past year, broader net insider selling totaled CA$3.8 million, which routinely prompts short-term caution from retail investors.
Balance of Record Growth vs. Hidden Costs: While Mako recently posted robust Q3 2026 production updates—recovering 12,743 oz of gold at its flagship San Albino mine—investors are heavily weighing the capital requirements of its newly expanding portfolio (such as the Moss Mine in Arizona and projects in Nevada/Guyana) alongside pending structural terms on its proposed Sailfish gold stream agreement.
Commodity Market Consolidation: Junior mining equities are highly sensitive to systemic volatility. After driving an immense 754% 3-year return, a routine sector-wide pullback and profit-taking cycle occurred as gold market spot prices leveled off.
.
~~~~~~~~~~~~~~~~~~~~~~~~~~~~~~~~~~~~~~~~~~~~~~~
================================================
Spanish Mountain Gold - Highlights of past drilling programs
================================================
Drilling in 2006 to 2008 intercepted numerous long intervals of placer gold over an area of 0.72 square kilometers, approximately 1.2 kilometers by 0.6 kilometer in the Main zone, including:
Hole 06-DDH-504 0.57 g/t over 227.50 meters
Hole 06-DDH-506: 0.56 g/t gold over 86.00 meters
Hole 06-DDH-512: 0.65 g/t gold over69.08 meters
Hole 06-DDH-509 0.86 g/t over 86.60 meters
Hole 06-DDH-522: 1.02 g/t over 36.00 meters
Hole 06-DDH-524: 0.75 g/t gold over40.43 meters
Hole 06-DDH-529: 1.54 g/t gold over 2.00 meters
Hole 06-DDH-535: 0.72 g/t gold over 72.22 meters
Hole 07-DDH-634: 2.76 g/t gold over 22.05 meters
Hole 07-DDH-635: 4.13 g/t gold over10.5 meters
Hole 07-DDH-637: 1.24 g/t gold over 50.0 meters
Hole 07-DDH-640: 1.32 g/t over 6.5 meters and 1.06 g/t over 13.5 meters
Hole 07-DDH-642: 1.04 g/t over 18.0 meters
Hole 07-DDH-644: 1.12 g/t over 84.5 meters
Hole 08-DDH-706: 1.16 g/t gold over 25.0 meter
Hole 08-DDH-714: 37.6 g/t gold over 1.0 meter and 1.13 g/t over 10.5 meters
Hole 08-DDH-722: 2.04 g/t gold over 47.5 meter
Hole 08-DDH-741: 1.02 g/t gold over 21.0 meter
Hole 08-DDH-744: 1.71 g/t gold over 14.5 meter
Hole 08-DDH-749: 6.26 g/t gold over 6.0 meter
Hole 08-DDH-766: 1.06 g/t gold over 5 meter
Hole 08-DDH-778: 1.82 g/t gold over 15.0 meter
Hole 08-DDH-816 (Main Zone): 31.3 g/t gold over 2.0 meters
Hole 08-DDH-823 (Main Zone): 2.94 g/t gold over 16.0 meters, including 0.75 meters of 48.46 g/t
Hole 08-DDH-836 (Main Zone): 20.0 g/t over 2.0 meters
Hole ROG-014: 5.64 g/t over 6.0 meters
Hole ROG-015: 5.72 g/t over 9.5 meters, including 25.7 g/t gold over 1.5 meter
.
Where did Spanish Mountain Gold's massive placer gold come from?
During the geological Subduction process 200 million years ago, the west coast of British Columbia buckled and the Earth's crust was pushed skyward, carrying with it massive orogenic gold veins. Over the 200 million years weathering eroded mountains into flood plains, disintegrated the gold veins and eroded the visible gold into fine placer gold, dispersing it in a wide area. Placer gold is heavier then the surrounding materials and deposited in river gravels, floodplains, and hillsides, it can be in the form of dust, flakes, or nuggets. Finding placer gold is a strong indicator that a source, most likely gold veins exist somewhere upstream or nearby, that explains why high grade gold is being discovered in the Phoenix zone and the K-zone surrounding the Main zone.
The width of gold veins ranges from a few centimeters to 25 meters or more. The entire network of an anastomosing system of veins and shear zones can be traced along strike for hundreds of meters. Vertical depth of gold veins can extend to depths in excess of 1.5 kilometers.
Images of Gold veins

Images of Placer gold

.
How orogenic gold veins are formed?
200 million years ago, during the collision of the world's tectonic plates, tremendous heat and pressure was generated, forcing metamorphic hydrothermal fluids containing dissolved gold and quartz to migrate upwards through fractured rocks and faults, forming channels. As the fluids cooled, gold and quartz was deposited in the rocks. Gold deposits formed this way is called orogenic gold, 75% of the gold mined in the world are orogenic gold, 25% are found in magma rocks.
.
Why gold is found in quartz veins?
Quartz is a piezoelectric material, meaning it generates an electric charge when subjected to stress of high temperature and pressure, these electric charges act on the dissolved gold in the hydrothermal fluid, causing it to solidify into gold grains, leading to the formation of large gold nuggets embedded in quartz veins as hydrothermal fluids cooled and precipitated gold and quartz in the rocks.
.
Why gold and fossil of marine life are found on top of the Rocky Mountain?
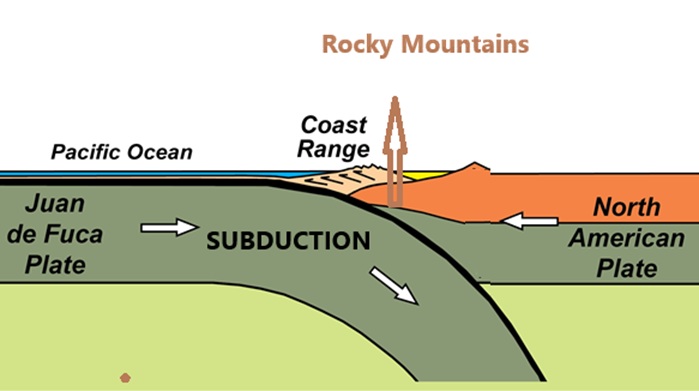
In the collision between the Pacific tectonic plate and the American tectonic plate, the denser Pacific plate submerged beneath the less denser American plate and the west coast from British Columbia to Peru buckled and was pushed upward and skyward, forming the Rocky Mountain as high as 12,970 feet at Mount Robson and the Andes Mountain in South America as high as high as 6,961 feet, bringing along with it gold deposits and fossils of marine life from the bottom of the ocean. The geological process is called Subduction.
Alluvial gold and placer gold are often used interchangeably because alluvial gold is a type of placer gold, specifically when the deposit is formed in a stream or river. "Placer gold" is the broader geological term for deposit concentrated by gravity from a source rock, while "alluvial gold" refers to deposits that are a result of water action.
.
.
.
Mineral Resource Estimate ( MRE ) as of September 21, 2026
https://investorshangout.com/images/MYImages/...212026.png
The mineral resource in the K-zone is not included in the MRE, all assays generated from this year's K-zone and Orca corridor are preserved to calculate final gold resources for the Feasibility Study. The Feasibility Study will introduce the project's maiden Proven & Probable Mineral Reserves to be incorporated in the Technical Report, they are the highest-confidence category in mining, proving that the ounces are legally, technically, and economically mineable.
.
===========================================
Conjectured gold resources estimate in the K-zone
===========================================
As of July 27, 2026 news release on K-zone drill assays
Drilling area:
K-zone drilling area is about 500 meter x 500 meter x 400 meter deep, so the volume of ores in the drilling area is about 100 million cubic meter.
Density of ore ranges from 2.2 to 4 tonnes per cubic meter depending on gold grade. So the tonnage in K-zone is at least 220 million tonnes. (100 x 10^6 cubic meters x 2.2 tonnes / cubic meters).
Average gold grade in the K-zone is 0.42 g/t and 220 million tonnes of 0.42 g/t contains 3.0 million ounces of gold.
Based on the silver to gold resource ratio of 1.56 in the current MRE (7.219 million ounces silver, 4.663 million ounces gold), with the high grade mineral resource in the K-zone added to the current MRE, the company's gold and silver Reserves in the anticipate Technical Report will likely be 8 million ounces gold and 12 million ounces silver. The company's wealth will make current share price and market capitalization evaluation ridiculous and ludicrous.
.
==============================
Spanish Mountain Gold and its peers
==============================
https://investorshangout.com/images/MYImages/...speers.jpg
Comparison of gold resources and market capitalization between Spanish Mountain Gold and its peers reveals that SMG's market valuation is tremendously undervalued. But bullish chart technicality forecasts that SMG will catch up with them soon, perhaps even emulate them because SMG has the highest Measured + Indicated resources among its peers. It will be even more undervalued when the Feasibility Study confirms the Proven and Probable gold reserves to be 8 million ounces.
In 2027 SPA's market capitalization could emulate that of OMG and MKO
Spanish Mountain Gold - In the prolific Cariboo region of British Columbia (SPA.V, SPAUF.OTCQB)
https://www.google.ca/maps/search/Cedar+Creek...FQAw%3D%3D
Mineral Resource Estimate: Page 12 of NI-43-101 Technical Report
https://spanishmountaingold.com/site/assets/f...-final.pdf
SPA.V weekly
https://stockcharts.com/sc3/ui/?s=SPA.V&p...2963243620
Key factors for share price decline:
Main factors: The decline is mainly technical as lack of support and failure in breaking through the 42 cents resistance caused frustration and fatigue among short term investors seeking quick profit, prompting sell off. Share price was also aggravated by news released by Xatśūll First Nation on October 1 announcing the termination of the 2021 and 2012 agreements with Spanish Mountain Gold citing the agreement was never finalized and that the project design has changed over the years. The Xatśūll news triggered panic selling from unsophisticated investors resulting in trading halt. Such news was already published in the 2026 Q2 Management Discussion & Analysis dated August 31. New agreements with the 3 First Nations are being drafted by the company.
Macroeconomic Drag: Mid-October 2026 brought a broader market sell-off driven by hotter-than-expected inflation metrics and looming expectations of a central bank interest rate hike. High-risk, pre-revenue junior resource explorers are usually the first to see capital flight when interest rate fears pick up.
Pre-Revenue Realities: Despite positive feasibility drilling results (e.g., 295 meters of 0.54 g/t gold), a final construction decision isn't slated until 2028. Investors looking for immediate stability opted to pull profits following the First Nations roadblock.
.
~~~~~~~~~~~~~~~~~~~~~~~~~~~~~~~~~~~~~~~~~~~~~~~~~~~~~~~~~~~~~~~~~
Blue Lagoon Resources - Dome Mountain Mine project, British Columbia (BLLG.CA)
https://www.google.ca/maps/place/Dome+Mountai...FQAw%3D%3D
Mineral Resource Estimate: https://bluelagoonresources.com/wp-content/up...slides.pdf
BLLG.CA weekly
https://stockcharts.com/h-sc/ui?s=BLLG.CA&...7291241482
Key factors for share price decline:
Heavy equity dilution: Recent multi-million dollar private placements priced significantly below the $1.10 peak. While the company successfully achieved commercial gold production at its Dome Mountain mine in May 2026, its financing structure created heavy downward pressure on the stock.
Dilutive Capital Raises at Lower Prices: In August 2026, strategic partners Ocean Partners and Nicola Mining injected a combined C$10 million into the company. However, these common shares were issued at C$0.60 per share. This heavily anchored the market price near that level, making a $1.10 valuation unsustainable.
High-Risk Production Decision: Blue Lagoon chose to move into commercial production without a formal feasibility study demonstrating economic and technical viability. This creates a high level of operational uncertainty and risk of technical failure, keeping institutional investors cautious.
Lagging Financial Clarity: Although the company has received C$16.5 million in provisional payments, these figures are gross numbers. The exact operating economics, mining costs, and actual profitability remain unconfirmed until upcoming quarterly financial reports are released.
.
~~~~~~~~~~~~~~~~~~~~~~~~~~~~~~~~~~~~~~~~~~~~~
1911 Gold - True North gold mine, Manitoba ( AUMB.V, AUMBF.OTCQC )
True North Gold Mine
https://www.google.ca/maps/place/True+North+G...FQAw%3D%3D
Mineral Resource Estimate
https://1911gold.com/news/press-releases/1911...ld-project
AUMB.V weekly
https://stockcharts.com/h-sc/ui?s=AUMB.V&...2963243620
The primary catalyst for this steep downward trend is a regulatory enforcement action by the British Columbia Securities Commission (BCSC), coupled with the acute execution risks and heavy dilution typical of development-stage junior mining companies
Key factors for share price decline:
1. BCSC Review and Mandatory PEA Retractions
The most severe damage to investor confidence occurred following a regulatory review by the British Columbia Securities Commission. In July 2026, the company was forced to issue a formal clarification and retraction regarding its February 2026 Preliminary Economic Assessment (PEA) for the True North Gold Project.
Overstated Certainty: 1911 Gold had to explicitly retract previous statements that over-inflated the certainty of its economic results and project timelines.
No Production Decision: The company had to formally clarify to the market that no official production decision has actually been made. This regulatory setback forced institutional and retail investors to heavily discount the project's near-term viability.
2. High Shareholder Dilution and Funding Demands
As an advanced-stage explorer without operational cash flow, 1911 Gold remains heavily dependent on capital markets to fund its underground drilling, mine dewatering, and equipment delivery at True North.
Capital Influx & Dilution: In June 2026, the company entered into a $20 million bought deal financing agreement. While this secured necessary runway, it severely diluted existing shareholders. Total shareholder dilution for AUMB reached a massive 39% over the cycle, putting permanent downward pressure on the per-share value.
3. Broad Market Fatigue Toward Junior Developers
Despite high spot prices for gold bullion serving as a macro tailwind, a risk-off rotation swept through the venture markets in late Q3 2026. Investors shifted capital away from smaller, high-risk junior development equities with high capital expenditure mandates and toward established, cash-flowing gold producers. This market-wide valuation reassessment, combined with localized profit-taking, accelerated AUMB's slide to its 52-week lows.
.
~~~~~~~~~~~~~~~~~~~~~~~~~~~~~~~~~~~~~~~~~~~~
Banyan Gold - AurMac Project in Yukon (BYN.V)
https://www.google.ca/maps/place/Banyan+Gold+...FQAw%3D%3D
Mineral Resource Estimate: https://banyangold.com/projects/aurmac/
BYN.V weekly
https://stockcharts.com/h-sc/ui?s=BYN.V&p...7291241482
BYN.V share price declined from its all-time high of $2.20 to $1.57, driven primarily by a massive capital raise and share dilution event, alongside typical "sell-the-news" profit-taking following key operational catalysts.
Key factors for share price decline:
Massive Equity Financing & Dilution: The most direct catalyst for the price drop was the announcement and rapid closing of a massive $54.3 million financing package. On September 20—just two days after the stock hit its peak—Banyan announced a $50 million Listed Issuer Financing Exemption (LIFE) offering and an $8 million private placement, both priced at $2.00 per share.
The Impact: When a junior miner issues millions of new shares, it heavily dilutes existing shareholders. Because the financing finally closed on September 29, it created an immediate cap on near-term upward momentum, causing the price to slide toward and eventually slip below the $2.00 offering price as supply overwhelmed demand.
Post-Catalyst Profit-Taking: Leading up to September 18, BYN experienced a powerful run-up fueled by anticipation surrounding its updated 8.6 million-ounce mineral resource update at the flagship AurMac Gold Project and its inclusion in the VanEck Junior Gold Miners ETF (GDXJ). Once these major multi-month milestones were achieved and the subsequent financing was structured, many short-term institutional and retail investors engaged in profit-taking.
Shift in Junior Mining Risk Appetite: Broad macro sentiment toward exploration and development-stage junior gold companies grew more cautious in late September and October. Despite historically high underlying gold prices, investors actively rotated and repositioned out of high-beta junior developers into safer producers as capital needs across the junior exploration sector expanded.
Despite the recent ~28% drop from its peak, Banyan's underlying long-term thesis remains heavily backed, notably highlighted by senior royalty giant Franco-Nevada subscribing for 10 million shares during the recent financing round.
.
~~~~~~~~~~~~~~~~~~~~~~~~~~~~~~~~~~~~~~~~~~~~~
Omai Gold Mines - Guyana (OMG.V)
https://www.google.ca/maps/place/OMAI+GOLD+MI...FQAw%3D%3D
Mineral Resource Estimate: https://omaigoldmines.com/omai-project/overview/
OMG.V weekly
https://stockcharts.com/sc3/ui/?s=OMG.V&p...2963243620
Key factors for share price decline:
"Sell the News" Post-PEA Consolidation: Omai Gold stock experienced a monumental run leading up to the release of its $4.0 Billion after-tax NPV in the Preliminary Economic Assessment in August 2026 and its definitive NI 43-101 technical report on October 5, 2026. Once these heavily anticipated updates became official, many early-stage investors locked in substantial profits.
Macro Sector Volatility: Junior and developer mining equities on the S&P/TSX Venture Composite Index have experienced broader pressure due to short-term pullbacks and volatility in spot gold pricing. Development-stage operations are highly sensitive to these broader market risk appetites.
Transition into Capital & Operational Risk: Now that the initial engineering studies are complete, investors are beginning to price in the longer-term hurdles. Moving from a study to real-world development requires substantial future financing, potential share dilution, and complex permitting timelines.
.
~~~~~~~~~~~~~~~~~~~~~~~~~~~~~~~~~~~~~~~~~~~~~
Mako Mining, Moss Mine, Arizona (MKO.V, MAKO.NASDAQ)
https://www.google.ca/maps/place/Moss+Mine/@3...FQAw%3D%3D
Mineral Resource Estimate
https://makominingcorp.com/news-media/press-r...nt_id=1146
Note: If MKO Mining's current 87 million shares outstanding is diluted 6 times to 529 million shares equaling to that of Spanish Mountain Gold, its 52-week high share price would be at $2.33 with 52-week high market capitalization of $1.33 billion.
MKO.V weekly
https://stockcharts.com/sc3/ui/?s=MKO.V&p...2963243620
Decline in Mako Mining share price is primarily driven by recent insider selling, broader sector volatility, and capital consolidation after massive multi-year gains. Despite strong underlying fundamentals, several distinct triggers shifted short-term investor sentiment.
Key Drivers of share price decline:
Major Insider Selling: Investor scrutiny increased following disclosures that Chief Operating Officer Jesse Munoz sold approximately CA$283,000 worth of stock (representing 30% of his total holdings) at an average price of CA$14.17. Over the past year, broader net insider selling totaled CA$3.8 million, which routinely prompts short-term caution from retail investors.
Balance of Record Growth vs. Hidden Costs: While Mako recently posted robust Q3 2026 production updates—recovering 12,743 oz of gold at its flagship San Albino mine—investors are heavily weighing the capital requirements of its newly expanding portfolio (such as the Moss Mine in Arizona and projects in Nevada/Guyana) alongside pending structural terms on its proposed Sailfish gold stream agreement.
Commodity Market Consolidation: Junior mining equities are highly sensitive to systemic volatility. After driving an immense 754% 3-year return, a routine sector-wide pullback and profit-taking cycle occurred as gold market spot prices leveled off.
.
~~~~~~~~~~~~~~~~~~~~~~~~~~~~~~~~~~~~~~~~~~~~~~~
================================================
Spanish Mountain Gold - Highlights of past drilling programs
================================================
Drilling in 2006 to 2008 intercepted numerous long intervals of placer gold over an area of 0.72 square kilometers, approximately 1.2 kilometers by 0.6 kilometer in the Main zone, including:
Hole 06-DDH-504 0.57 g/t over 227.50 meters
Hole 06-DDH-506: 0.56 g/t gold over 86.00 meters
Hole 06-DDH-512: 0.65 g/t gold over69.08 meters
Hole 06-DDH-509 0.86 g/t over 86.60 meters
Hole 06-DDH-522: 1.02 g/t over 36.00 meters
Hole 06-DDH-524: 0.75 g/t gold over40.43 meters
Hole 06-DDH-529: 1.54 g/t gold over 2.00 meters
Hole 06-DDH-535: 0.72 g/t gold over 72.22 meters
Hole 07-DDH-634: 2.76 g/t gold over 22.05 meters
Hole 07-DDH-635: 4.13 g/t gold over10.5 meters
Hole 07-DDH-637: 1.24 g/t gold over 50.0 meters
Hole 07-DDH-640: 1.32 g/t over 6.5 meters and 1.06 g/t over 13.5 meters
Hole 07-DDH-642: 1.04 g/t over 18.0 meters
Hole 07-DDH-644: 1.12 g/t over 84.5 meters
Hole 08-DDH-706: 1.16 g/t gold over 25.0 meter
Hole 08-DDH-714: 37.6 g/t gold over 1.0 meter and 1.13 g/t over 10.5 meters
Hole 08-DDH-722: 2.04 g/t gold over 47.5 meter
Hole 08-DDH-741: 1.02 g/t gold over 21.0 meter
Hole 08-DDH-744: 1.71 g/t gold over 14.5 meter
Hole 08-DDH-749: 6.26 g/t gold over 6.0 meter
Hole 08-DDH-766: 1.06 g/t gold over 5 meter
Hole 08-DDH-778: 1.82 g/t gold over 15.0 meter
Hole 08-DDH-816 (Main Zone): 31.3 g/t gold over 2.0 meters
Hole 08-DDH-823 (Main Zone): 2.94 g/t gold over 16.0 meters, including 0.75 meters of 48.46 g/t
Hole 08-DDH-836 (Main Zone): 20.0 g/t over 2.0 meters
Hole ROG-014: 5.64 g/t over 6.0 meters
Hole ROG-015: 5.72 g/t over 9.5 meters, including 25.7 g/t gold over 1.5 meter
.
Where did Spanish Mountain Gold's massive placer gold come from?
During the geological Subduction process 200 million years ago, the west coast of British Columbia buckled and the Earth's crust was pushed skyward, carrying with it massive orogenic gold veins. Over the 200 million years weathering eroded mountains into flood plains, disintegrated the gold veins and eroded the visible gold into fine placer gold, dispersing it in a wide area. Placer gold is heavier then the surrounding materials and deposited in river gravels, floodplains, and hillsides, it can be in the form of dust, flakes, or nuggets. Finding placer gold is a strong indicator that a source, most likely gold veins exist somewhere upstream or nearby, that explains why high grade gold is being discovered in the Phoenix zone and the K-zone surrounding the Main zone.
The width of gold veins ranges from a few centimeters to 25 meters or more. The entire network of an anastomosing system of veins and shear zones can be traced along strike for hundreds of meters. Vertical depth of gold veins can extend to depths in excess of 1.5 kilometers.
Images of Gold veins
Images of Placer gold
.
How orogenic gold veins are formed?
200 million years ago, during the collision of the world's tectonic plates, tremendous heat and pressure was generated, forcing metamorphic hydrothermal fluids containing dissolved gold and quartz to migrate upwards through fractured rocks and faults, forming channels. As the fluids cooled, gold and quartz was deposited in the rocks. Gold deposits formed this way is called orogenic gold, 75% of the gold mined in the world are orogenic gold, 25% are found in magma rocks.
.
Why gold is found in quartz veins?
Quartz is a piezoelectric material, meaning it generates an electric charge when subjected to stress of high temperature and pressure, these electric charges act on the dissolved gold in the hydrothermal fluid, causing it to solidify into gold grains, leading to the formation of large gold nuggets embedded in quartz veins as hydrothermal fluids cooled and precipitated gold and quartz in the rocks.
.
Why gold and fossil of marine life are found on top of the Rocky Mountain?
In the collision between the Pacific tectonic plate and the American tectonic plate, the denser Pacific plate submerged beneath the less denser American plate and the west coast from British Columbia to Peru buckled and was pushed upward and skyward, forming the Rocky Mountain as high as 12,970 feet at Mount Robson and the Andes Mountain in South America as high as high as 6,961 feet, bringing along with it gold deposits and fossils of marine life from the bottom of the ocean. The geological process is called Subduction.
Alluvial gold and placer gold are often used interchangeably because alluvial gold is a type of placer gold, specifically when the deposit is formed in a stream or river. "Placer gold" is the broader geological term for deposit concentrated by gravity from a source rock, while "alluvial gold" refers to deposits that are a result of water action.
.
.
.