.jpg)
US Dollar, Gold, XAU, SPA.V - News and Technical Analysis ( October 13, 2026)
The US Dollar (USD) trades lower against its major currency peers on Tuesday due to lower United States (US) Treasury Yields but it will likely extend advance to near 103.00
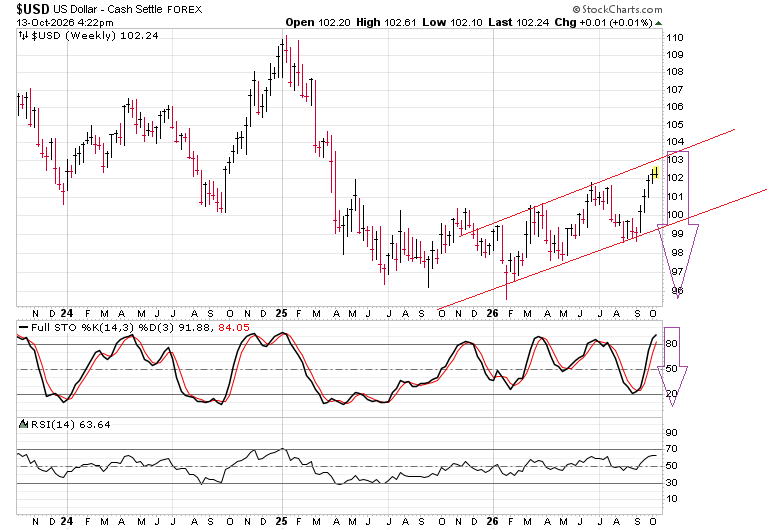
US Dollar Index weekly
https://stockcharts.com/sc3/ui/?s=%24USD&...4982523747
https://www.fxstreet.com/news/us-dollar-index...2610130608
Higher rates could be needed to avoid ‘inflationary mindset’ taking hold, says Fed’s Hammack
https://www.cnbc.com/2026/10/12/beth-hammack-...olicy.html
~~~~~~~~~~~~~~~~~~~~~~~~~~~~~~~~~~~~~~~~~~~~~~~~~~~~~~~
~~~~~~~~~~~~~~~~~~~~~~~~~~~~~~~~~~~~~~~~~~~~~~~~~~~~~~~
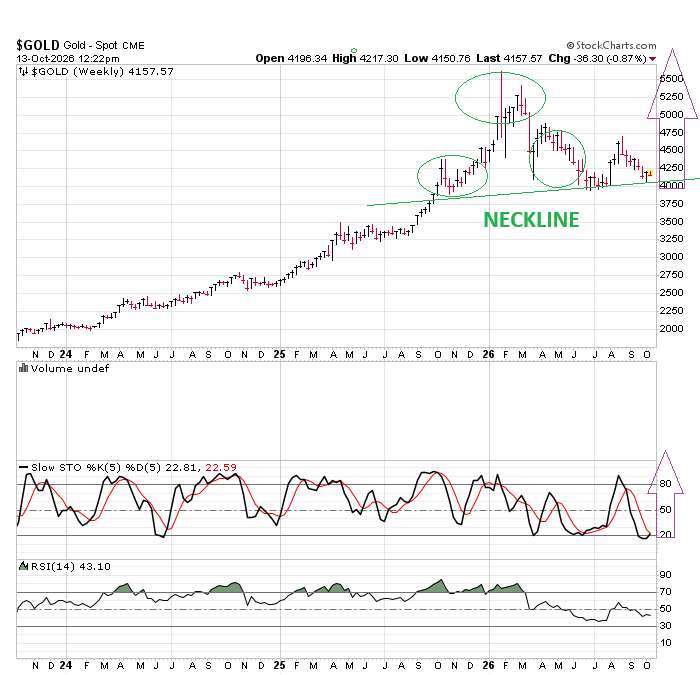
Gold weekly - Strong support at $4000
https://stockcharts.com/sc3/ui/?s=%24GOLD&...8609492691
Current Price & Market Snapshot
• Spot / Futures Price: Spot gold trades near $4,178–$4,182 per ounce, while December U.S. gold futures trends higher at $4,202.70 per ounce.
• Immediate Support & Resistance: Technical support sits between $4,134 and $4,150
• Month-to-Date / Year-to-Date: Prices have faced a pullback from August highs, down roughly 3% over the past month, though remaining higher year-over-year.
Key Drivers Shaping the Outlook
• U.S. Dollar & Yields: A strong U.S. dollar (sitting near an 18-month high) and elevated 10-year Treasury yields continue to create headwinds for non-yielding bullion.
• Upcoming Economic Data: Market participants are closely watching the U.S. Consumer Price Index (CPI) report on Wednesday, Producer
Price Index (PPI) and retail sales on Thursday, and comments from Federal Reserve Chair Kevin Warsh on Friday.
• Interest Rate Expectations: Markets assign a high probability (around 87.7%) to a Federal Reserve rate hike by December, keeping near-term upside contained.
• Underpinning Factors: Continuous central bank reserve diversification (including multi-month accumulation by China's central bank) and strong ETF inflows provide a floor above the $4,000–$4,134 support zone.
~~~~~~~~~~~~~~~~~~~~~~~~~~~~~~~~~~~~~~~~~~~~~~~~~~~~~~~~
~~~~~~~~~~~~~~~~~~~~~~~~~~~~~~~~~~~~~~~~~~~~~~~~~~~~~~~~
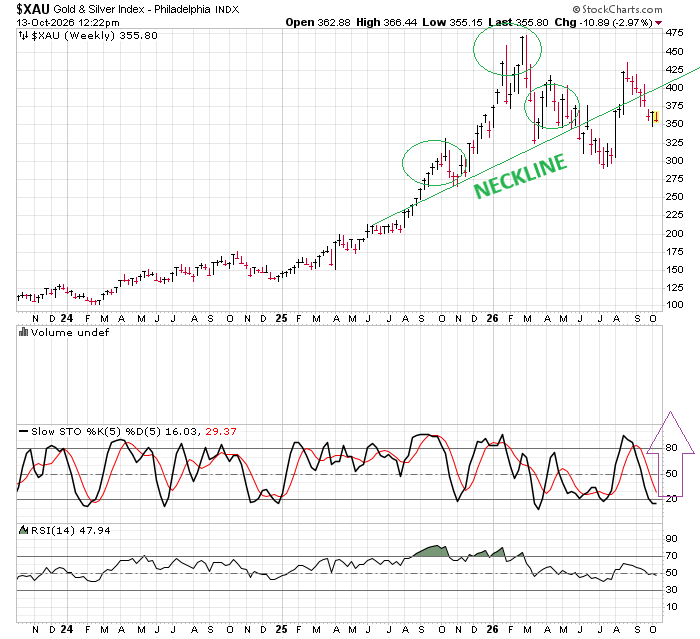
XAU Mining stock Index is in a pull back
https://stockcharts.com/sc3/ui/?s=%24XAU&...4158123608
~~~~~~~~~~~~~~~~~~~~~~~~~~~~~~~~~~~~~~~~~~~~~~~~~~~~~~~~
~~~~~~~~~~~~~~~~~~~~~~~~~~~~~~~~~~~~~~~~~~~~~~~~~~~~~~~~
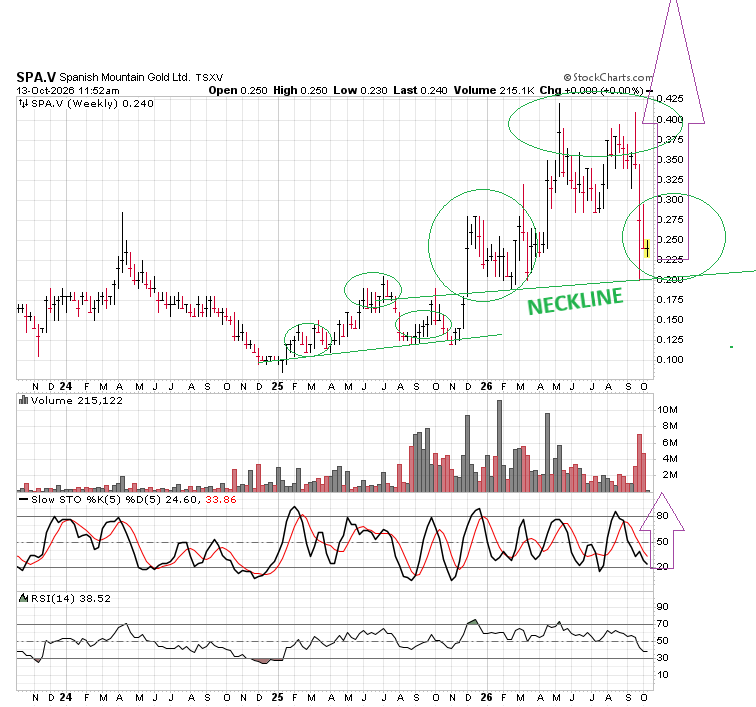
SPA.V is testing a break down from last week's convergence should reverse up strongly next week and show strong technicality in the coming weeks
https://stockcharts.com/sc3/ui/?s=SPA.V&p...8609492691
.
.
.
The US Dollar (USD) trades lower against its major currency peers on Tuesday due to lower United States (US) Treasury Yields but it will likely extend advance to near 103.00
US Dollar Index weekly
https://stockcharts.com/sc3/ui/?s=%24USD&...4982523747
https://www.fxstreet.com/news/us-dollar-index...2610130608
Higher rates could be needed to avoid ‘inflationary mindset’ taking hold, says Fed’s Hammack
https://www.cnbc.com/2026/10/12/beth-hammack-...olicy.html
~~~~~~~~~~~~~~~~~~~~~~~~~~~~~~~~~~~~~~~~~~~~~~~~~~~~~~~
~~~~~~~~~~~~~~~~~~~~~~~~~~~~~~~~~~~~~~~~~~~~~~~~~~~~~~~
Gold weekly - Strong support at $4000
https://stockcharts.com/sc3/ui/?s=%24GOLD&...8609492691
Current Price & Market Snapshot
• Spot / Futures Price: Spot gold trades near $4,178–$4,182 per ounce, while December U.S. gold futures trends higher at $4,202.70 per ounce.
• Immediate Support & Resistance: Technical support sits between $4,134 and $4,150
• Month-to-Date / Year-to-Date: Prices have faced a pullback from August highs, down roughly 3% over the past month, though remaining higher year-over-year.
Key Drivers Shaping the Outlook
• U.S. Dollar & Yields: A strong U.S. dollar (sitting near an 18-month high) and elevated 10-year Treasury yields continue to create headwinds for non-yielding bullion.
• Upcoming Economic Data: Market participants are closely watching the U.S. Consumer Price Index (CPI) report on Wednesday, Producer
Price Index (PPI) and retail sales on Thursday, and comments from Federal Reserve Chair Kevin Warsh on Friday.
• Interest Rate Expectations: Markets assign a high probability (around 87.7%) to a Federal Reserve rate hike by December, keeping near-term upside contained.
• Underpinning Factors: Continuous central bank reserve diversification (including multi-month accumulation by China's central bank) and strong ETF inflows provide a floor above the $4,000–$4,134 support zone.
~~~~~~~~~~~~~~~~~~~~~~~~~~~~~~~~~~~~~~~~~~~~~~~~~~~~~~~~
~~~~~~~~~~~~~~~~~~~~~~~~~~~~~~~~~~~~~~~~~~~~~~~~~~~~~~~~
XAU Mining stock Index is in a pull back
https://stockcharts.com/sc3/ui/?s=%24XAU&...4158123608
~~~~~~~~~~~~~~~~~~~~~~~~~~~~~~~~~~~~~~~~~~~~~~~~~~~~~~~~
~~~~~~~~~~~~~~~~~~~~~~~~~~~~~~~~~~~~~~~~~~~~~~~~~~~~~~~~
SPA.V is testing a break down from last week's convergence should reverse up strongly next week and show strong technicality in the coming weeks
https://stockcharts.com/sc3/ui/?s=SPA.V&p...8609492691
.
.
.