.jpg)
Technical Correction is healthy ..........................................
US$, GOLD, XAU, SPA.V weekly
US$ weekly (Next support is at 90)
https://stockcharts.com/sc3/ui/?s=%24USD&...5438379490
GOLD weekly
https://stockcharts.com/sc3/ui/?s=%24GOLD&...4222068030
XAU Mining Index weekly
https://stockcharts.com/sc3/ui/?s=%24XAU&...0950278014
SPA.V weekly
https://stockcharts.com/sc3/ui/?s=SPA.V&p...2963243620
During the technical correction of gold price last week, investors sold off mining stocks across the board. Technical correction is healthy, it forms a step stone to much higher price.
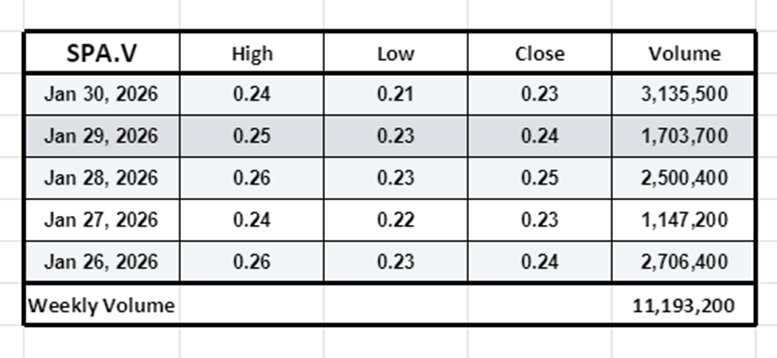
As short term gamblers dumped 11 million shares of SPA.V, other astute investors scooped them up, it is a phenomenon of of wealth transfer from the unfit to the fit. "One man's trash is another man's gold". Director Lembit Janes bought up 1.432 million shares.
There will be numerous technical corrections in gold price in the months and years to come until gold price hits US$147,000 per ounce, propelled by outflow of funds from bitcoin into gold. Every pull provides a buying opportunity.
As of January 30, 2026, the total U.S. national debt stands at approximately $38.52 trillion. Driven by consistent federal budget deficits, this figure represents over 100% of the country's GDP. Interest on this debt is a major expenditure, exceeding $2.6 billion daily, with debt per household reaching roughly $285,127.
The United States holds the world's largest official gold reserves, totaling approximately 8,133.5 tonnes (over 261 million troy ounces) as of early 2026, a figure that has remained largely unchanged for decades. Primarily stored at Fort Knox (KY), West Point (NY), and the Denver Mint, this stockpile is valued at well over $1 trillion.
If US government is to sell all its gold reserves to clear its national debts, gold price would has to be US$147,000 per ounce
US$, GOLD, XAU, SPA.V weekly
US$ weekly (Next support is at 90)
https://stockcharts.com/sc3/ui/?s=%24USD&...5438379490
GOLD weekly
https://stockcharts.com/sc3/ui/?s=%24GOLD&...4222068030
XAU Mining Index weekly
https://stockcharts.com/sc3/ui/?s=%24XAU&...0950278014
SPA.V weekly
https://stockcharts.com/sc3/ui/?s=SPA.V&p...2963243620
During the technical correction of gold price last week, investors sold off mining stocks across the board. Technical correction is healthy, it forms a step stone to much higher price.
As short term gamblers dumped 11 million shares of SPA.V, other astute investors scooped them up, it is a phenomenon of of wealth transfer from the unfit to the fit. "One man's trash is another man's gold". Director Lembit Janes bought up 1.432 million shares.
There will be numerous technical corrections in gold price in the months and years to come until gold price hits US$147,000 per ounce, propelled by outflow of funds from bitcoin into gold. Every pull provides a buying opportunity.
As of January 30, 2026, the total U.S. national debt stands at approximately $38.52 trillion. Driven by consistent federal budget deficits, this figure represents over 100% of the country's GDP. Interest on this debt is a major expenditure, exceeding $2.6 billion daily, with debt per household reaching roughly $285,127.
The United States holds the world's largest official gold reserves, totaling approximately 8,133.5 tonnes (over 261 million troy ounces) as of early 2026, a figure that has remained largely unchanged for decades. Primarily stored at Fort Knox (KY), West Point (NY), and the Denver Mint, this stockpile is valued at well over $1 trillion.
If US government is to sell all its gold reserves to clear its national debts, gold price would has to be US$147,000 per ounce