BAC Daily Chart I was asked to share a chart o
Post# of 2561

BAC Daily Chart
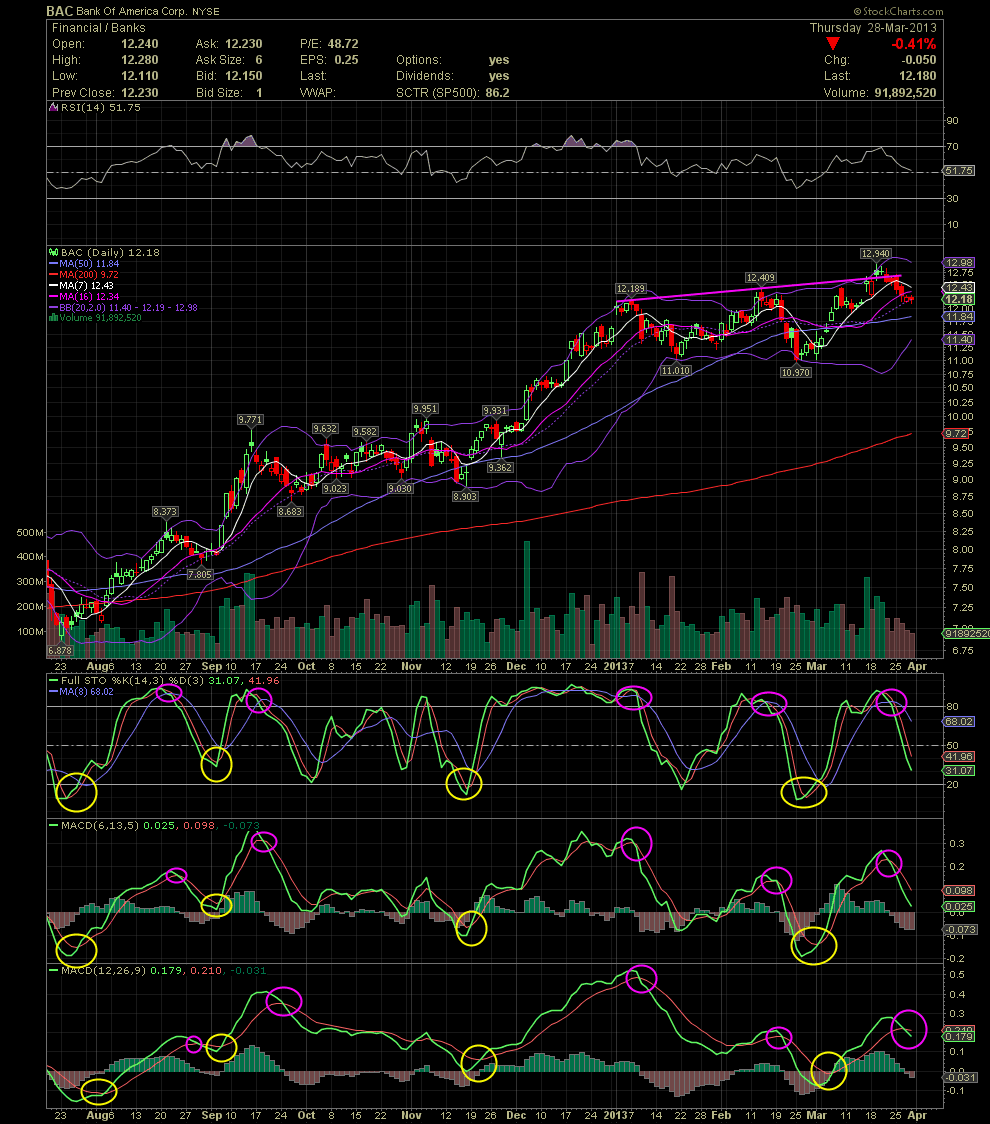
I was asked to share a chart on BAC and to give an opinion of the technicals. You can link back to Mar 19 for my comments on the BAC chart back then. Looks like the stock tried to break above the upper resistance line but failed after a couple of days. I circled a few of the indicators that are possible signals of buys and sells. The stock is obviously in a pullback currently and trading below the MA20 by just .01. I'm not liking the trend of the FullSto and MACDs either. As always, news could change the downtrend quickly but for now, I would wait for a time when the indicators are a little more favorable.

 (0)
(0) (0)
(0)