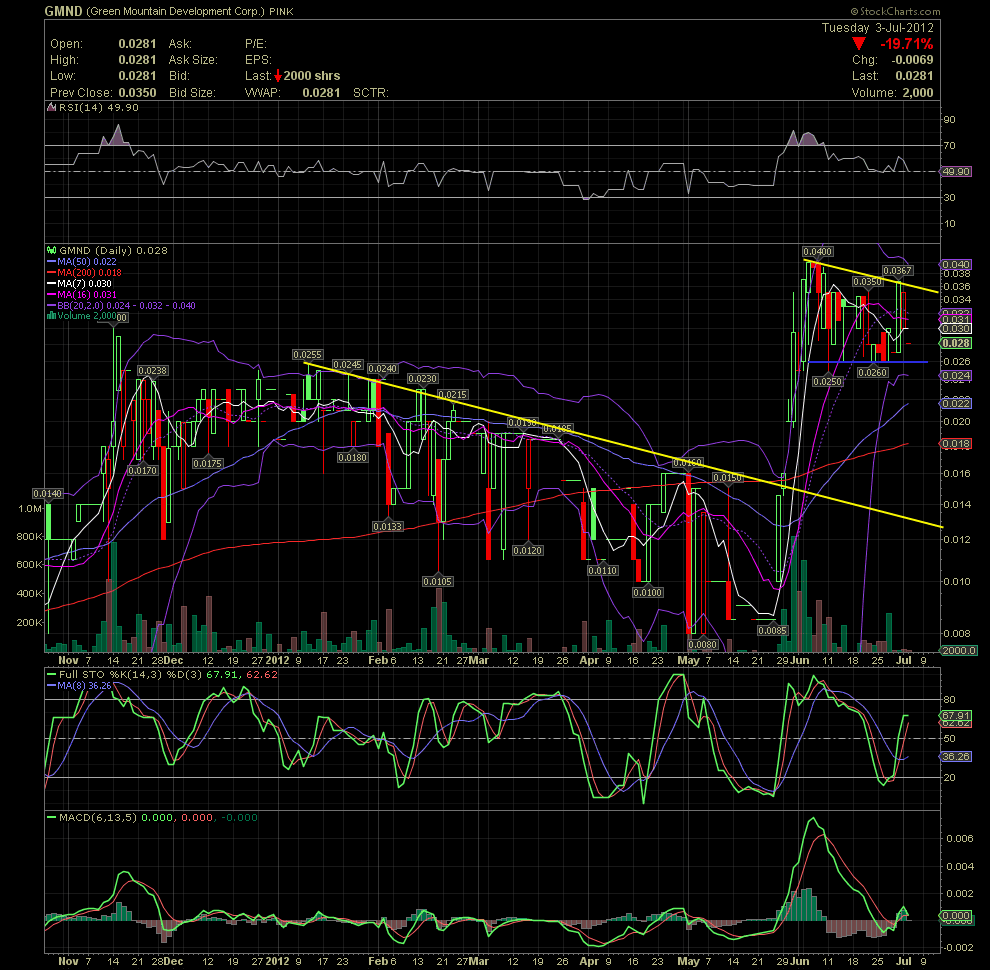
GMND Daily Chart.......... The time to buy or add
Post# of 56

GMND Daily Chart.......... The time to buy or add more has come imo.
My friends and I have been accumulating GMND from as low as .0085 to the current .026-.04 range based on rapidly changing material events (please see the Info Box, she's loaded with good stuff). I was suggest you invest only if you are willing to make so decent profits over the next few months. I am hoping to see .35-.50 by the end of the year into the first quarter of 2013.
Here's the daily chart. Most of the overbought indicators of last month have reset into a neutral point. The RSI which reached 80 in late May/early June has fallen to the 50 level. The same goes for the FullSto and MACD. Although GMND isn't a chart play, one has to pay attention to what it is telling us. After the swift move to .04 last month, the stock has now settled into a flag formation with the .026 level holding as support for almost one month now. Tuesday's drop of 20% was on a $56 sale. Obviously, someone needed some money for a few firecrackers for the Independence Day celebrations today.
I'm optimistically looking forward to .10 by August and .40 by the end of the year.

 (0)
(0) (0)
(0)