PNTV Weekly Chart....... And for those that like t
Post# of 382

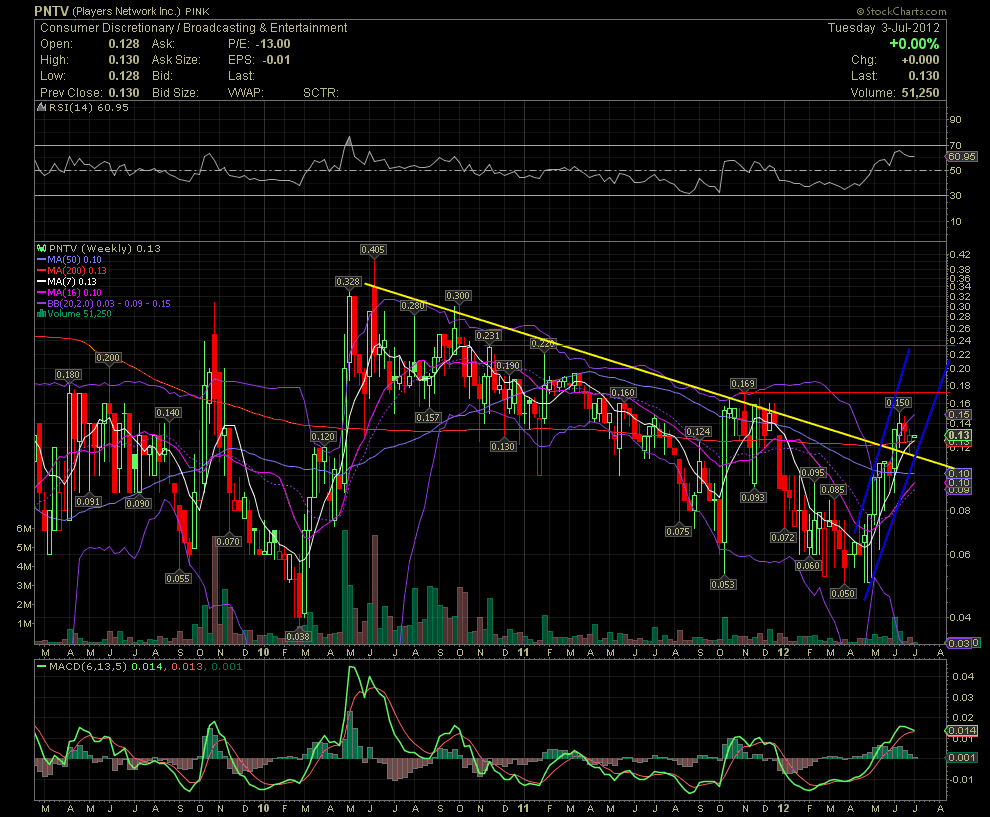
PNTV Weekly Chart....... And for those that like the longer term view, and why I look at them, here's the PNTV multi month view of things that I see developing.
As I've mentioned a few times in the past, I began accumulating PNTV with a few friends when I felt the bottom was in at the .05 level on Apr 30/May 1. I also suggesting that a break above the multi month declining line (yellow) would bring into play a test of the MA200 and closing the gap of late December which would occur at .15.
So far the stock has closed above the MA200 for five weeks straight now. The rising channel established since May 1 is still intact. A break above the horizontal resistance at .169 will result, imo, a test of the next horizontal resistance at the .23 level. Once PNTV breaks above that line, I'll begin to look at the resistance points in the .30s which haven't been seen since 2010.
PNTV is Looking Good!!

 (0)
(0) (0)
(0)