IFHR Daily Chart I played IFHR about 18 months
Post# of 30

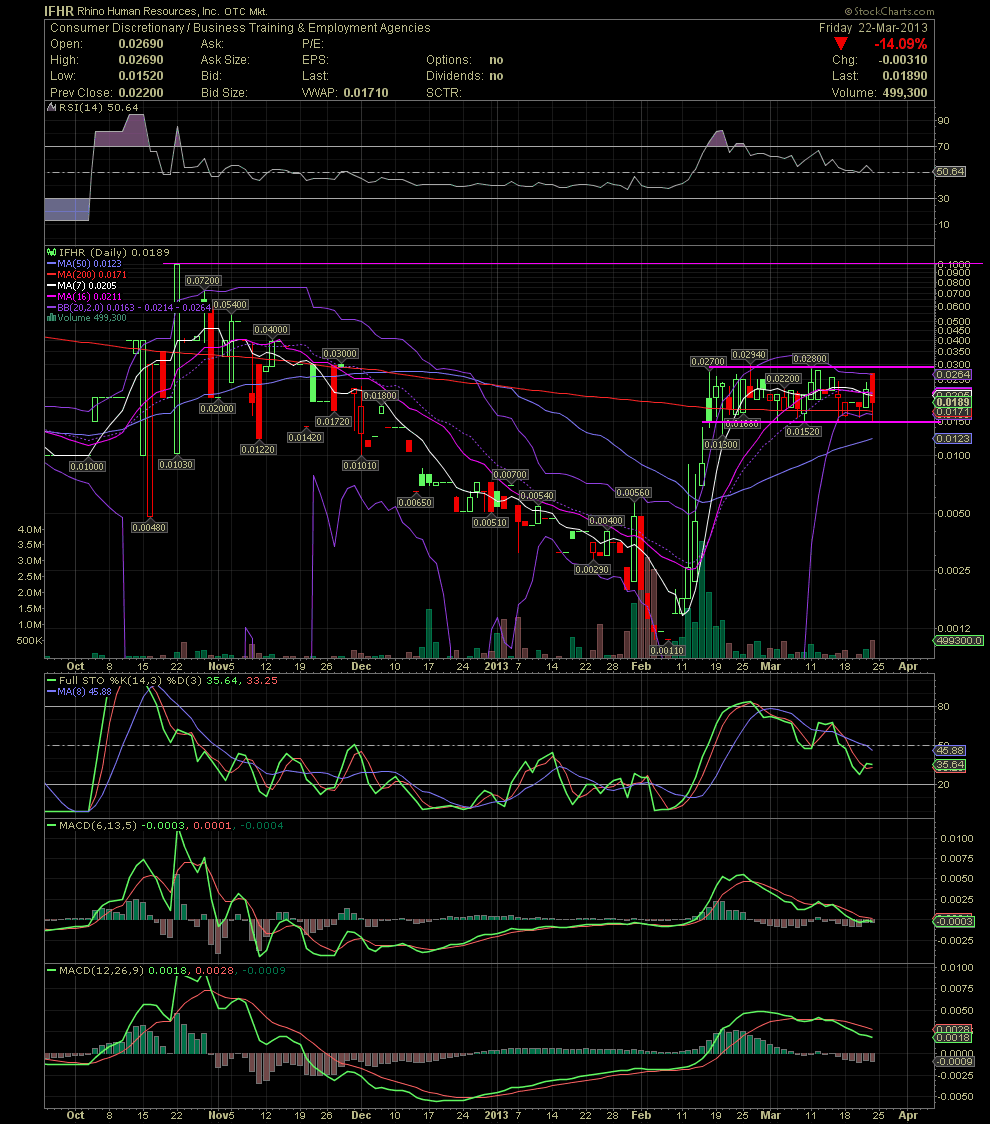
IFHR Daily Chart
I played IFHR about 18 months ago when it ran to .25 during speculation of a reverse merger. I began to take a position here a few days back back under .02, but began adding more aggressively this last week. A couple of friends of mine having been loading since .002. Might we worth buying a few. Rumors of news regarding a long awaited reverse merge. So treat it as a speculative play here at the .02 level with the potential to see .25 over the next few weeks/month per the rumors. I have no way of putting a number on IFHR as I have zero idea of what the company is working on. This stock has a rumored float of approx 10 mil but a stated OTC Market float of 8.8 mil although that's a few months old. Therefore, it's pretty thinly traded and will make for some upside fun should any strong, material news hit.
http://www.otcmarkets.com/stock/IFHR/company-info
As to the chart, you can clearly see a flag pole formation with a subsequent pennant channel ranging between .015 to the high .02s. A break above .0294/.003, might bring into a play a test of the various upper resistance levels at .04 to .10. Most of the indicators aren't giving a buy signal, but I'm accumulating anyway. We saw some late Friday selling, but unfortunately I was away in meetings. Otherwise, approx 200-300k of those .016-.018s would have been mine. GLTA
 (0)
(0) (0)
(0)