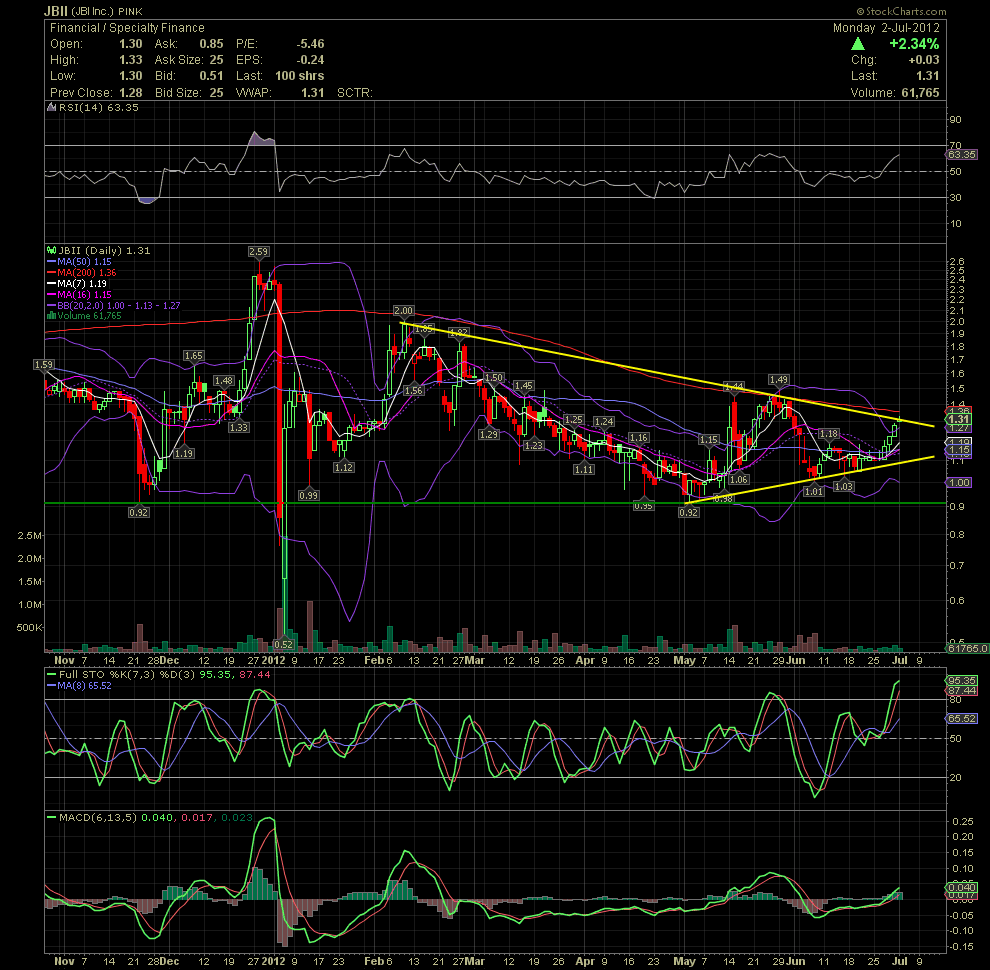
JBII Daily Chart................ JBII is now se
Post# of 43068

JBII Daily Chart................
JBII is now set for a major move to the upside imo. Immediately ahead is the multi month declining tops line (yellow) and the MA200. The RSI has been moving up nicely for over two weeks now. The MACD crossed to a buy signal about one week ago while the stock was still trading in the 1.00s before breaking up to the 1.30s. The share price is also clearly above the MA7 and MA16 which also just crossed up thru the MA50.
Yes! I'm really liking JBII. This is going to be a $100 stock over the next 2-3 years. Mark this post if you like.

 (0)
(0) (0)
(0)