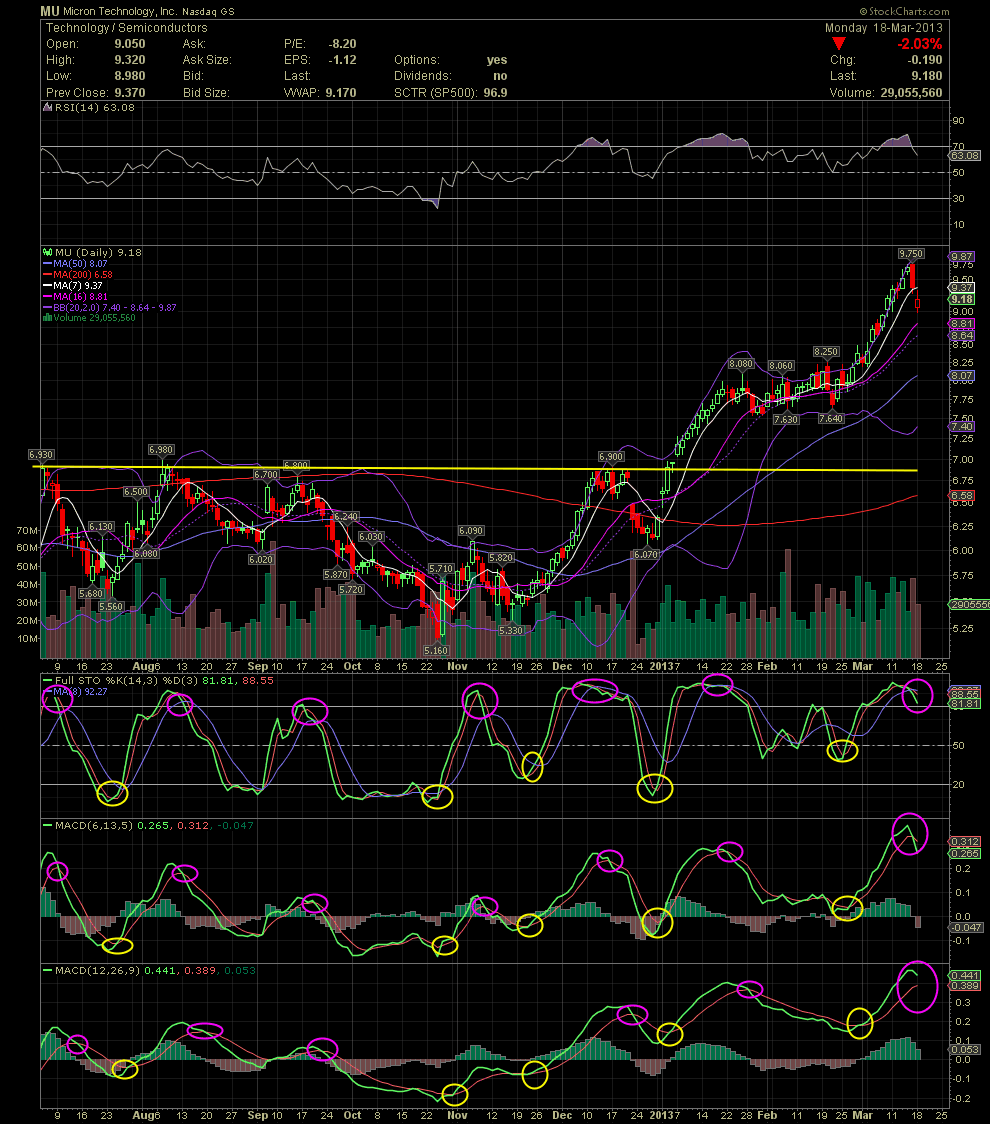
MU Daily Chart....... Link Back to My March 10 Cha
Post# of 2561
MU Daily Chart....... Link Back to My March 10 Chart on MU (It's the post I'm responding to)
I mentioned at the end of my March 10 MU Daily Chart post that one should watch for the next 'pink cirlce', or in the case of technicals the topping formation and negative crosses. Since then, the share price on Friday reversed, the FullSto and shorter term MACD crossed to the downside. The longer term MACD is curling but hasn't given its sell signal yet. The first caution signs began on March 11 or so after when the FullSto began to curl. Although one indicator can never stand by itself, when caution signs rise up, one has to begin paying closer attention to possibility of a sell. Although I rarely catch the top or bottom, in the case of the last series of MU charts I've shared, the last swing trade was worth approx 15-24% depending upon your entry. I know three of you entered right at the bottom at the 7.70 levels. I'd have to say that was a decent move as you can see the numerous bottoms at the 7.63/7.64s. For those of you trading MU with me, let's just wait for the indicators to set up once again. Three great swing trades since November. Let's be patient and wait for number 4. GLTA

 (0)
(0) (0)
(0)