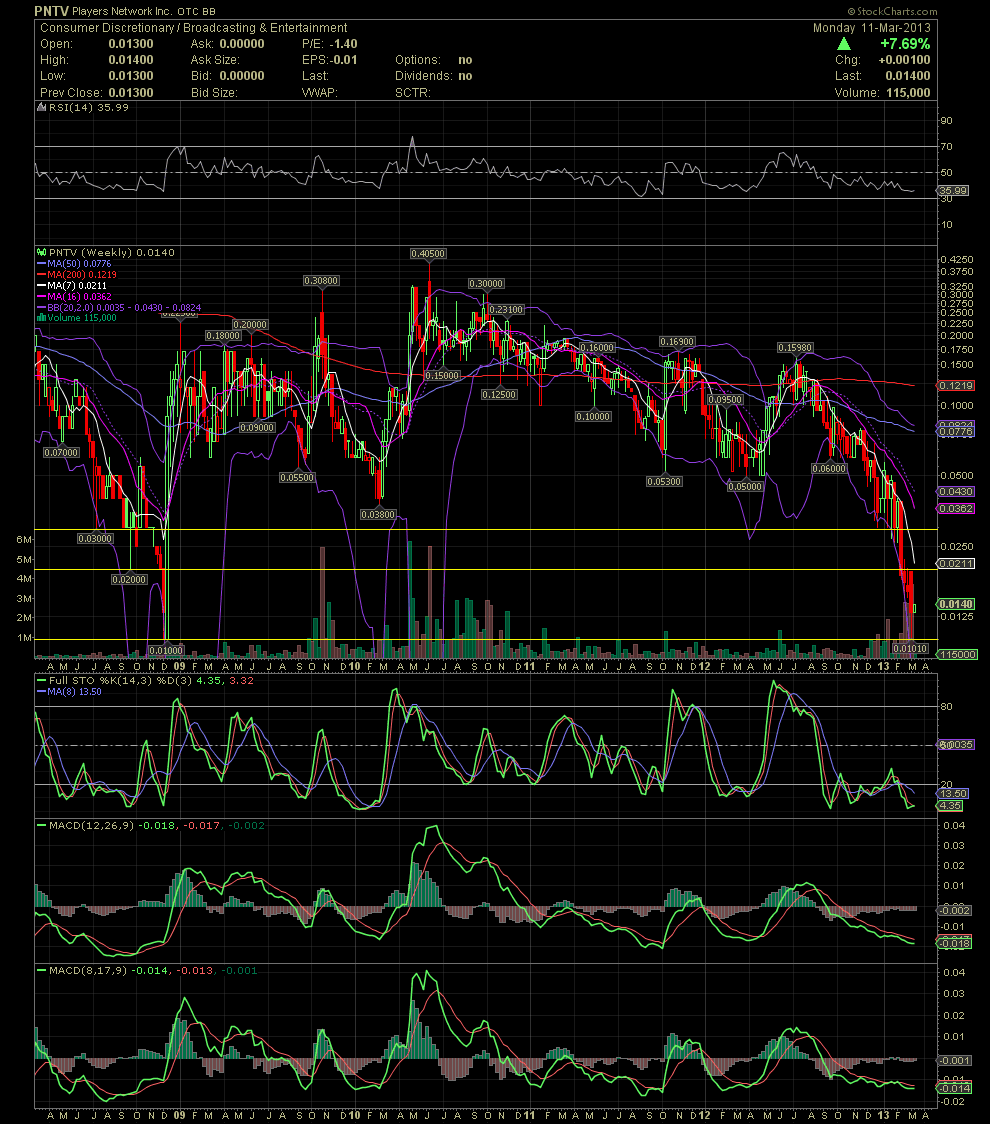
PNTV Weekly Chart.......... .01 Bottom of Dec 2009
Post# of 2561

PNTV Weekly Chart.......... .01 Bottom of Dec 2009 Finally Offering a Reversal?
Hello Again Hawkeiz! I've been watching the weekly chart for months and hoping that the .05 levels of late 2011 and mid 2012 would have held. But with the toxic financing that the company got into, obviously destroyed the stock price. So one had to go back many years to look for possible support levels. But with the massive selling that occurred, all previous support levels were taken out. So it looks like the .0101 seen last week is the support level while bouncing off lows not scene since late 2009. I don't know how much more stock the toxic lenders will be receiving when they convert the balance of their notes, but those willing to take the risk and hold on for a while, the stock is ridiculously undervalued solely based on a liquidation value which can be valued at .05-.06 imo.

 (0)
(0) (0)
(0)