Investors Hangout Stock Message Boards Logo
  • Mailbox
  • Favorites
  • Boards
    • The Hangout
    • NASDAQ
    • NYSE
    • OTC Markets
    • All Boards
  • Whats Hot!
    • Recent Activity
    • Most Viewed Boards
    • Most Viewed Posts
    • Most Posted
    • Most Followed
    • Top Boards
    • Newest Boards
    • Newest Members
  • Blog
    • Recent Blog Posts
    • Recently Updated
    • News
    • Stocks
    • Crypto
    • Investing
    • Business
    • Markets
    • Economy
    • Real Estate
    • Personal Finance
  • Market Movers
  • Interactive Charts
  • Login - Join Now FREE!
  1. Home ›
  2. Stock Message Boards ›
  3. Stock Boards ›
  4. Mindpix Corporation (MPIX) Message Board

MPIX Daily Chart.......... An Excellent Day Yester

Message Board Public Reply | Private Reply | Keep | Replies (2)                   Post New Msg
Edit Msg () | Previous | Next


Post# of 5570
Posted On: 03/06/2013 9:15:50 AM
Avatar
Posted By: Big Tuna

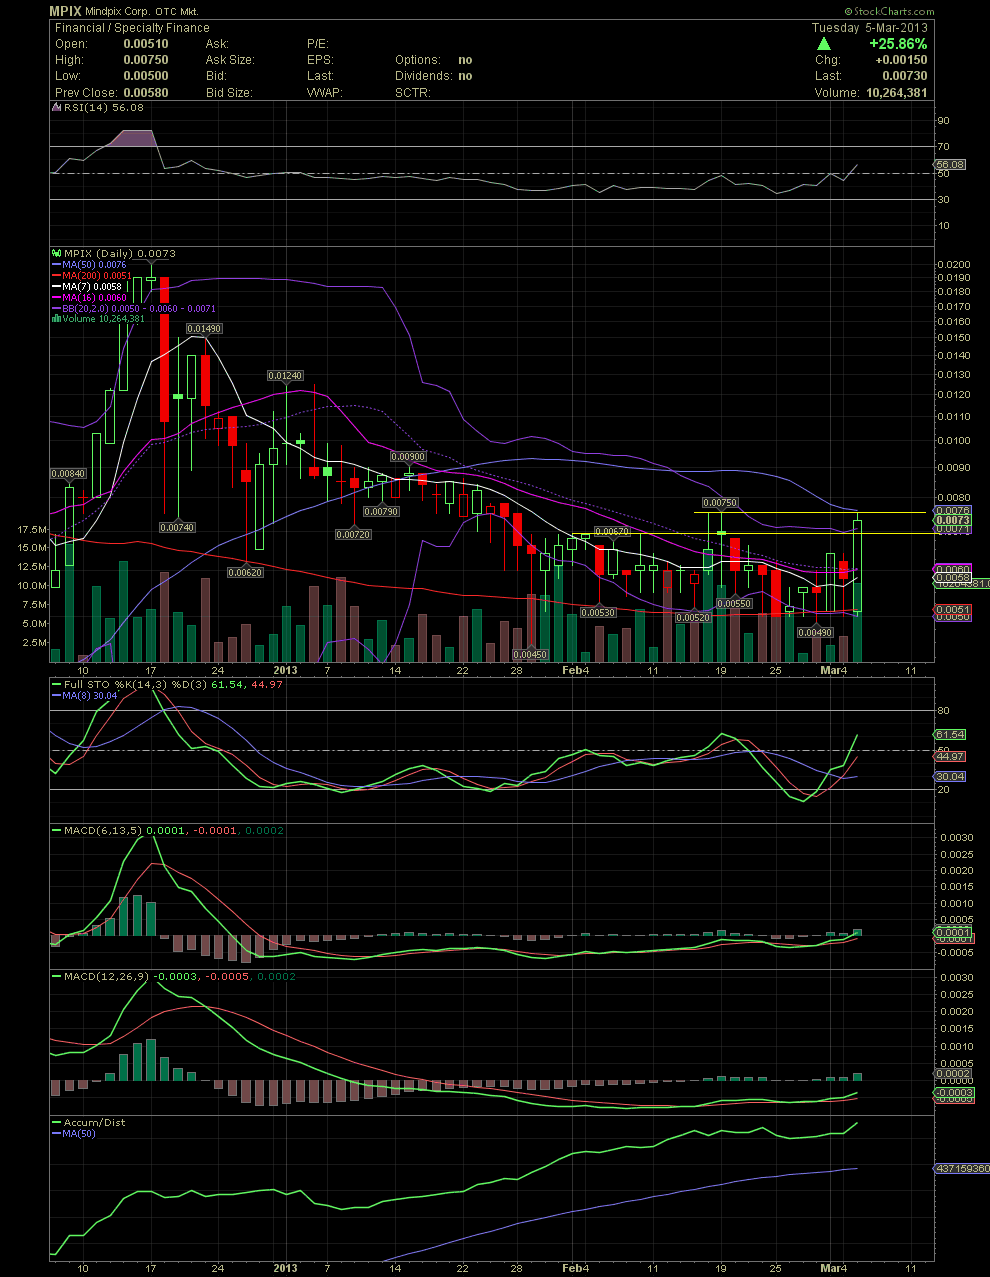
MPIX Daily Chart.......... An Excellent Day Yesterday


Yesterday was a strong day for MPIX as she is beginning to move on much smaller volume. Link back to the following line regarding my post of the trading on Friday, March 1:


http://investorshangout.com/post/638929/MPIX-...nteresting


Most everything I like to see at the beginning of a new leg up is occurring. The move yesterday pretty much engulfed the entire trading of the last 26 trading days as one can see on the chart. The share price has moved above many moving averages to include the MA7, 10, 16, 20, and 100 while continuing to hold the long term MA200 since first crossing above it in early December. The FullSto already crossed to a buy late last week. The MACDs has crossed over to a minor buy signal with the shorter term MACD crossing over the zero line. What would be important next would be to see the share price recapture the MA50 which is sitting at .0076. Yesterday the stock moved up and thru the first horizontal resistance of .007. Next up is a very short term top of .0075. Both are represented with yellow lines on the chart below. A break and close above .0075 should bring into play a move to the next horizontal resistance point of .009. And the last time the RSI broke over its 50 line, the stock ran from a low of .0012 to .02.


I'm telling you MPIXers, launching from these levels versus those of last October with similar indicators is a very good thing. Should the company begin updating its shareholders with the many projects that ZZYX and MPIX have been working on, it would catapult the share price into the .03-.05 range. Once again, do your DD, use a few of the revenue equations that I've shared, and come to you own conclusion whether MPIX is a flip or a longer term hold as DROP was for many a couple of years ago as that stock ran from .0015 to $1.25 over 18 months. Either way, I wish everyone a very green investment with MPIX as is has been since the .0008s of October. The best is coming quickly now imo. GLTA


(0)
(0)


Mindpix Corporation (MPIX) Stock Research Links


  1.  
  2.  


  3.  
  4.  
  5.  


Investors Hangout

Home

Mailbox

Message Boards

Favorites

Whats Hot

Blog

Settings

Privacy Policy

Terms and Conditions

Disclaimer

Contact Us

Whats Hot

Recent Activity

Most Viewed Boards

Most Viewed Posts

Most Posted Boards

Most Followed

Top Boards

Newest Boards

Newest Members

Investors Hangout Message Boards

Welcome To Investors Hangout

Stock Message Boards

American Stock Exchange (AMEX)

NASDAQ Stock Exchange (NASDAQ)

New York Stock Exchange (NYSE)

Penny Stocks - (OTC)

User Boards

The Hangout

Private

Global Markets

Australian Securities Exchange (ASX)

Euronext Amsterdam (AMS)

Euronext Brussels (BRU)

Euronext Lisbon (LIS)

Euronext Paris (PAR)

Foreign Exchange (FOREX)

Hong Kong Stock Exchange (HKEX)

London Stock Exchange (LSE)

Milan Stock Exchange (MLSE)

New Zealand Exchange (NZX)

Singapore Stock Exchange (SGX)

Toronto Stock Exchange (TSX)

Contact Investors Hangout

Email Us

Follow Investors Hangout

Twitter

YouTube

Facebook

Market Data powered by QuoteMedia. Copyright © 2025. Data delayed 15 minutes unless otherwise indicated (view delay times for all exchanges).
Analyst Ratings & Earnings by Zacks. RT=Real-Time, EOD=End of Day, PD=Previous Day. Terms of Use.

© 2025 Copyright Investors Hangout, LLC All Rights Reserved.

Privacy Policy |Do Not Sell My Information | Terms & Conditions | Disclaimer | Help | Contact Us